The FourStar Galaxy Evolution Survey (ZFOURGE) aims to establish an observational benchmark of galaxy properties at z > 1 by deriving 1-2% accurate redshifts of ∼60,000 galaxies at 1 < z < 3.
Most normal L∗ galaxies during this crucial epoch are too faint for spectroscopy, which has forced us to rely on inaccurate broadband photometric redshifts in the past. In response, we have equipped FourStar with innovative “medium-bandwidth” filters from 1 − 1.8μm, which enable accurate and robust redshifts to z = 3.5.
These observations allow us to observe complete galaxy samples down to low mass at z > 1, explore the role of mass and environment in galaxy transformations, measure galaxy scaling relations and the shape of the stellar mass function to z = 3, to find luminous galaxies at z = 6-9, and to identify high-redshift 1.5 < z < 2.5 (proto)clusters.
Scientific goals
What causes galaxies to stop star formation? ZFOURGE can identify quiescent galaxies from their Balmer/4000A break to z = 3.5. We will correlate the strength of the break with stellar mass, surface density (compactness), AGN activity, and local galaxy density. If quiescence is driven by any of these properties, correlations with SFR should exist.
Galaxy scaling relations and the stellar mass function to z = 3.5. The evolution of the mass- and luminosity functions, the size-mass relation, the SFR-mass relation, and the color-mass and color-magnitude relations, provide insight in how galaxies acquire their gas, convert it into stars, and grow by merging. ZFOURGE provides accurate redshifts, thus remove the main source of uncertainty in these and other measurements, reducing both statistical and systematic errors in the SMF by a factor of > 3.
The role of environment. The morphology-density relation is a classic result of galaxy evolution, stating that massive, quiescent early-type galaxies are more abundant in clusters than in the field. ZFOURGE is expected to resolve the local galaxy density field and detect large scale structures at z > 1, such as high-redshift groups and (proto)clusters. The sample is sufficiently large to determine the relation between galaxy properties and environment at fixed mass and redshift, allowing us disentangle the two effects.
The high-redshift universe z = 6−10. One of the quests of galaxy formation studies is to trace back the evolutionary history of galaxies directly to the birth of the first population of stars. ZFOURGE opens up the exciting possibility of identifying the brightest z ~ 8 galaxies, by selecting galaxies that are not detected in the J1-filter, but clearly detected in the J2 + J3-bands. We expect to find 3 − 9 galaxies at z ~ 8 per deep FourStar pointing, placing strong constraints of the shape of the luminosity function and providing extremely compelling candidates for spectroscopic follow up.
Additional science with ZFOURGE. Beyond the core science, many other projects are made possible by the deep medium-band photometry and accurate redshifts:
identifying massive evolved galaxies z > 3.5
mapping the correlation of galaxies to dark matter at z > 2 through galaxy clustering studies
confirming several high-redshift 1.5 < z < 2.5 (proto)clusters
measuring accurate U V −slopes of galaxies at z = 5 − 7
efficient and reliable pre-selection for deep spectroscopic follow up
The Fourstar Galaxy Evolution Survey (ZFOURGE) was conducted using the FourStar imager (Persson et al. 2013) on the 6.5m Magellan Baade telescope at Las Campanas Observatory. The use of medium-band filters in the near-IR (van Dokkum et al. 2009) allows for accurate sampling at wavelengths that bracket the Balmer break of galaxies leading to more well-constrained photometric redshifts at 1 < z < 4 than with broadband filters alone. In conjunction with existing optical through mid-IR photometry, this dataset provides a comprehensive sampling of the 0.3 – 8 micron spectral energy distribution of galaxies.
ZFOURGE is composed of three 11′ x 11′ pointings with coverage in the CDFS (Giacconi et al. 2002), COSMOS (Capak et al. (2007) and UDS (Lawrence et al. 2007). The 5sigma depth in a circular aperture of D=0.6” in the Ks band is 26.2-26.5 in the CDFS, COSMOS and UDS fields respectively at a typical seeing of ~0.4″. For more information regarding ZFOURGE consult Straatman et al. (2016).
5 sigma AB magnitude depths (CDFS, COSMOS, UDS; D=0.6” apertures)
J1
25.6
26.0
25.6
J2
25.5
26.0
25.9
J3
25.5
25.7
25.6
Hs
24.9
25.1
25.1
Hl
25.0
24.9
25.2
Ks
26.2-26.5
25.5
25.7
Ks depths correspond to a co-addition of the Fourstar imaging with public Ks-band imaging.
[Field]
[Coordinates]
[Total Survey Area]
[Number of Objects]
[Kband FWHM]
CDFS
[03 32 27, -27 45 52]
[128 sq. arcmin]
[30911]
[0.46”]
COSMOS
[10 00 31, +02 17 03]
[135 sq. arcmin]
[20786]
[0.47”]
UDS
[02 17 15, -05 11 53]
[189 sq. arcmin]
[22093]
[0.44”]
Comparison of secure spectroscopic redshifts from the literature to photometric redshifts across all three pointings in ZFOURGE. Top: of the 1,526 sources compared, we find a NMAD scatter in ∆z/(1 +zspec) of 0.10 with about 3% of sources at ∆z/(1 + zspec) > 0.15. Bottom: the residual between the spectroscopic and photometric redshifts, divided by 1+zspec. The red solid, dashed and dotted lines indicate, respectively, ∆z/(1 + zspec) = 0 ± 0, ± 0.05, and ± 0.15.
Completeness corrected number counts for each field observed with ZFOURGE. Sources with < 80% completeness are shown with open symbols. We recover at least 80% down to very deep Ks-band magnitudes of 25.4 − 25.9 and 50% down to 25.6 − 26.2. For comparison, the Ks-band completeness corrected number counts of similar galaxy surveys are indicated in grayscale.
Three different redshift quality tests, σz from testing against spectroscopic samples, σz,pairs from a redshift pair test (Quadri et al., 2010) for sources with Ks < 23.5 AB mag, and the photometric redshift uncertainty from the p(z) from EAZY, σz,EAZY . These correspond well at all redshifts, indicating excellent redshift accuracies for ZFOURGE: 1 − 2%.
The benefit of using medium bandwidth filters in the near-IR on photometric redshift accuracy. σz, derived from a redshift pair test, is clearly smaller if the near-IR medium band filters are used (compared to near-IR broadband), especially at 1.5 < z < 2.5.
The FourStar Galaxy Evolution Survey (ZFOURGE) is a large and deep medium-band imaging survey aimed at establishing an observational benchmark of galaxy properties at redshift z > 1. ZFOURGE survey is carried out using an extremely efficient near-infrared FOURSTAR instrument on the Magellan telescope, in three HST legacy fields: COSMOS, CDFS, and UDS.
Accurate redshifts for ~60,000 galaxies at z>1
Most normal L* galaxies at 1 < z < 3 are too faint for spectroscopic observations, which has forced us to rely on inaccurate broadband photometric redshifts in the past. In response, we have equipped FourStar with innovative “medium-bandwidth” filters from 1 − 1.8μm (see Figure), which enable accurate and robust redshifts with ~2% accuracy for ~60,000 galaxies.
This GIF shows the increased sampling of a galaxy SED (C: Adam Tomczak).
We greatly acknowledge support from the Carnegie Observatories and the staff at the Las Campanas observatories during this survey.
The Department of Physics & Astronomy (“we”, “us” or “our”) respects your privacy. We are providing this privacy statement to ensure that we make every effort to respect your privacy and to inform you what information we collect, how we use it, how we protect it, when we can release it, and how you are entitled to access it. This privacy statement applies to the web sites we administer and the email you send us. Because we host several web sites that perform varied functions, some sites may adopt different privacy and security statements that reflect their functionality.
Information Collection, Use and Release
When you visit our web sites to read or download information, we do not collect personal information about you. In particular, we do not use “cookies” to collect or store personal information. However, we do collect and store technical information about your visit in server logs. Some of our web sites also send general information about your visit to Google Analytics. We do not send personal information to Google Analytics. We use personal information that you provide via email or through other online means to serve your needs, such as responding to an inquiry or other request for information. This may involve redirecting your inquiry or comment to another person or department better suited to meeting your needs. We use information from server logs to evaluate accessibility or gauge the popularity of various features on our web sites. We also use that information for general reporting and management functions. Specifically, we use log analysis tools to generate statistics, determine technical design specifications, and identify system performance issues. Occasionally, we acquire, record, and analyze portions of the data that you enter, store, or transmit through our web sites or email you send us. We release this information – only when legally required – to help law enforcement investigations, legal proceedings, or internal investigations of Texas A&M University rule and regulation violations. These groups would use the information to track the electronic interactions back to the source computer(s) or account(s). Except for education records governed by the Family Educational Rights and Privacy Act of 1974 (FERPA), all information collected from our web sites, including server logs, and information collected from web forms, or email you send to us, may be subject to the Texas Public Information Act. This means that while we do not actively share information, in some cases we may be compelled by law to release this information.
Cookies
A cookie file contains unique information that a web site can use to store such things as passwords, or pages you have visited, or the date you last looked at a specific page. Cookies can also identify your server session at a particular web site. We do not use cookies to collect or store personal information.
Sessions
A server session is like a cookie that is stored on a web server. It can store information such as what web pages you visited, when you visited a web page, or personal information that you supply or information the web page retrieves for you. Occasionally, we use server sessions to store information about your session. For example, we may require you to login to a web site and store your username; distinguishing you from other people using the site.
Server Logs
We store the following information in our server logs:
User/client hostname – The hostname or IP address of the user/client requesting access
HTTP header, “user agent” – The user-agent information includes the type of browser, its version, and the operating system on which it is running
HTTP header, “referrer” – The referrer specifies the page from which the client accessed the current page
System date – The date and time of the user/client request
Full request – The exact request the user/client made
Status – The status code the server returned to the user/client
Content length – The content length, in bytes, of the document sent to the user/client
Method – The request method used
Universal Resource Identifier (URI) – The location of a resource on the server including web pages, images, and other files
Query string of the URI – Anything after the question mark in a URI
Protocol – The transport protocol and version used
Google Analytics
Google Analytics stores the following information on their web site:
User/client hostname – The host-name or IP address of the user/client requesting access
HTTP header, “user agent” – The user-agent information includes the type of browser, its version, and the operating system on which it is running
Universal Resource Identifier (URI) – The location of a resource on the server including web pages, images, and other files
HTTP header, “referrer” – The referrer specifies the page from which the user/client accessed the current page
Screen colors – Color processing ability of the user/client screen
Screen resolution – The resolution or dimensions of the user/client screen
Service Provider – The Internet service provider of the user/client
Mobile device – If user/client is a mobile device, the manufacturer of the mobile device
Mobile carrier – If user/client is a mobile device, its Internet service provider
Bandwidth (Internet connection speed) – The speed of the user/client connection from their Internet service provider
Java support – If Java is enabled
Flash version – Which version of Adobe Flash is installed
Geographic data – Country, State, City, language preference of the user/client
Time on page – The time spent on a web page
Google Analytics shares information with Google. Please read Google’s Privacy Policy for more information.
Information Security
We employ extensive security measures consistent with the Texas Administrative Code (TAC) “Information Security Standards” and Texas A&M University Rules and Standard Administrative Procedures to protect against unauthorized access, disclosure, modification, or destruction of information under our control, as well as the loss, misuse, or alteration of our web sites and/or associated electronic information resources. The information resources that support our web sites undergo an annual information security risk assessment via the Information Security Awareness Assessment and Compliance (ISAAC) system. The ISAAC system assesses the security posture of information systems and measures compliance with information security standards.
Information Access
The Texas Public Information Act, with a few exceptions, gives you the right to be informed about the information our web sites collect about you. It also gives you the right to request a copy of that information, and to have the university correct any of that information. You may request to receive and review any of this information, or request corrections to it, by contacting the TAMU Public Information Officer or the TAMU Office of Open Records, 1181 TAMU, College Station, Texas, 77843-1181, at 979-862-7777.
Questions
If you have any questions about this privacy and security statement, the practices of our web sites, or your use of our web sites, please send email to Web Support or by postal mail to: Department of Physics & Astronomy ATTN: Web Development 4242 TAMU College Station, TX 77843
ZFOURGE is a 45 night imaging program taken with the FourStar near-infrared camera on Magellan. We combine deep imaging in J1, J2, J3, Hs, Hl, and Ks with public legacy surveys to fit Spectral Energy Distributions for >60,000 galaxies. Please acknowledge ZFOURGE in any resulting publications, preferably by referencing the ZFOURGE survey paper by Straatman et al. (2016).
In the 2016 Data Release, we provided our extensive catalogs and calibrated image mosaics for the ZFOURGE fields for broader use in the astronomy community. The 2017 Data Release is largely the same but adds several segmentation and detection images, as well as calibration files and PSFs.
The complete latest release is available on Vizier under the description “FourStar galaxy evolution survey (ZFOURGE) (Straatman+, 2016).” If you previously downloaded data from Vizier, nothing has changed. However, downloads from the ZFOURGE website before May 2018 have been updated.
The images and catalogs as a subset are available below.
We investigate the properties of galaxies as they shut off star formation over the 4 billion years surrounding peak cosmic star formation. To do this, we categorize ∼7000 galaxies from 1 < z < 4 into 90 groups based on the shape of their spectral energy distributions (SEDs) and build composite SEDs with R ∼ 50 resolution. These composite SEDs show a variety of spectral shapes and also show trends in parameters such as color, mass, star formation rate, and emission-line equivalent width. Using emission-line equivalent widths and strength of the 4000 Å break, D(4000), we categorize the composite SEDs into five classes: extreme emission line, star-forming, transitioning, post-starburst, and quiescent galaxies. The transitioning population of galaxies shows modest Hα emission (EWREST ∼ 40 Å) compared to more typical star-forming composite SEDs at log10(M/Msol) ∼ 10.5 (EWREST ∼ 80 Å). Together with their smaller sizes (3 kpc vs. 4 kpc) and higher Sérsic indices (2.7 vs. 1.5), this indicates that morphological changes initiate before the cessation of star formation. The transitional group shows a strong increase of over 1 dex in number density from z ∼ 3 to z ∼ 1, similar to the growth in the quiescent population, while post-starburst galaxies become rarer at z < 1.5. We calculate average quenching timescales of 1.6 Gyr at z ∼ 1.5 and 0.9 Gyr at z ∼ 2.5 and conclude that a fast-quenching mechanism producing post-starbursts dominated the quenching of galaxies at early times, while a slower process has become more common since z ~ 2.
Figure: Example composite SEDs for each of our classifications, plotted with vertical offsets for clarity. Emission line galaxies (ELGs; magenta), star-forming galaxies with (DSFG) and without (SFG) significant dust attenuation (blue), transition galaxies (TGs; green), post-starburst galaxies (PSBs; orange), and quiescent galaxies (QGs; red) are clearly distinguishable based on emission features and D(4000) strength.Figure: Morphological characteristics of galaxies in different composite SED classes. Top: Sérsic indices for galaxies in our sample according to mass and classification, color-coded as in previous figures. Points are slightly offset along the abscissa for clarity, and error bars show the 16%–84% range in values for analog galaxies in composite SEDs of the class and binned mass range. Bottom: size–mass plane for galaxies in our composite SEDs. The SF galaxies follow the size–mass relations from Allen et al. (2017) (thickgrayline) quite well, while at 1 < z < 3 all other classes are smaller in size for a given mass (left). At 2.5 < z < 4 (right), the ELGs have similar sizes, while PSBs are smaller. In both cases, the non-star-forming classes lie near the compactness selection criterion of Barro et al. (2013), shown as a dashed line.Figure: Comoving number densities of QGs (red), PSBs (orange), TGs (green), and mass-matched SFGs (blue) against redshift. Our results are consistent with the results from Wild et al. (2016), shown as hatched shaded regions. Results from NMBS (Whitaker et al. 2012a) are shown as non-hatched shaded regions. Notably, the shapes of the TG and QG curves appear quite similar, which is suggestive of them being along a similar evolutionary pathway. While both these tracks flatten out toward lower redshifts, the PSBs show strong evidence for a turnover around z ∼ 1.5.
We find evidence for galaxies with at least two quenching patterns. The greater and increasing number density of the TGs at low redshifts (0.5 dex larger than PSBs at z = 1.25) implies that this group/quenching pathway is becoming more common, while the PSBs are becoming rarer at z < 1.5. This is potentially due to a longer timescale associated with said pathway, on the order of 1.5 Gyr, a factor of 1.5–7 times longer than the post-starburst phase is expected to last, and which cannot have occurred before z ∼ 4. The process that brings SFGs into the green valley creates changes in galaxy color, sSFR, size, and Sérsic index. The morphologies of galaxies appear, on average, to begin evolution toward higher Sérsic index before star formation ceases.


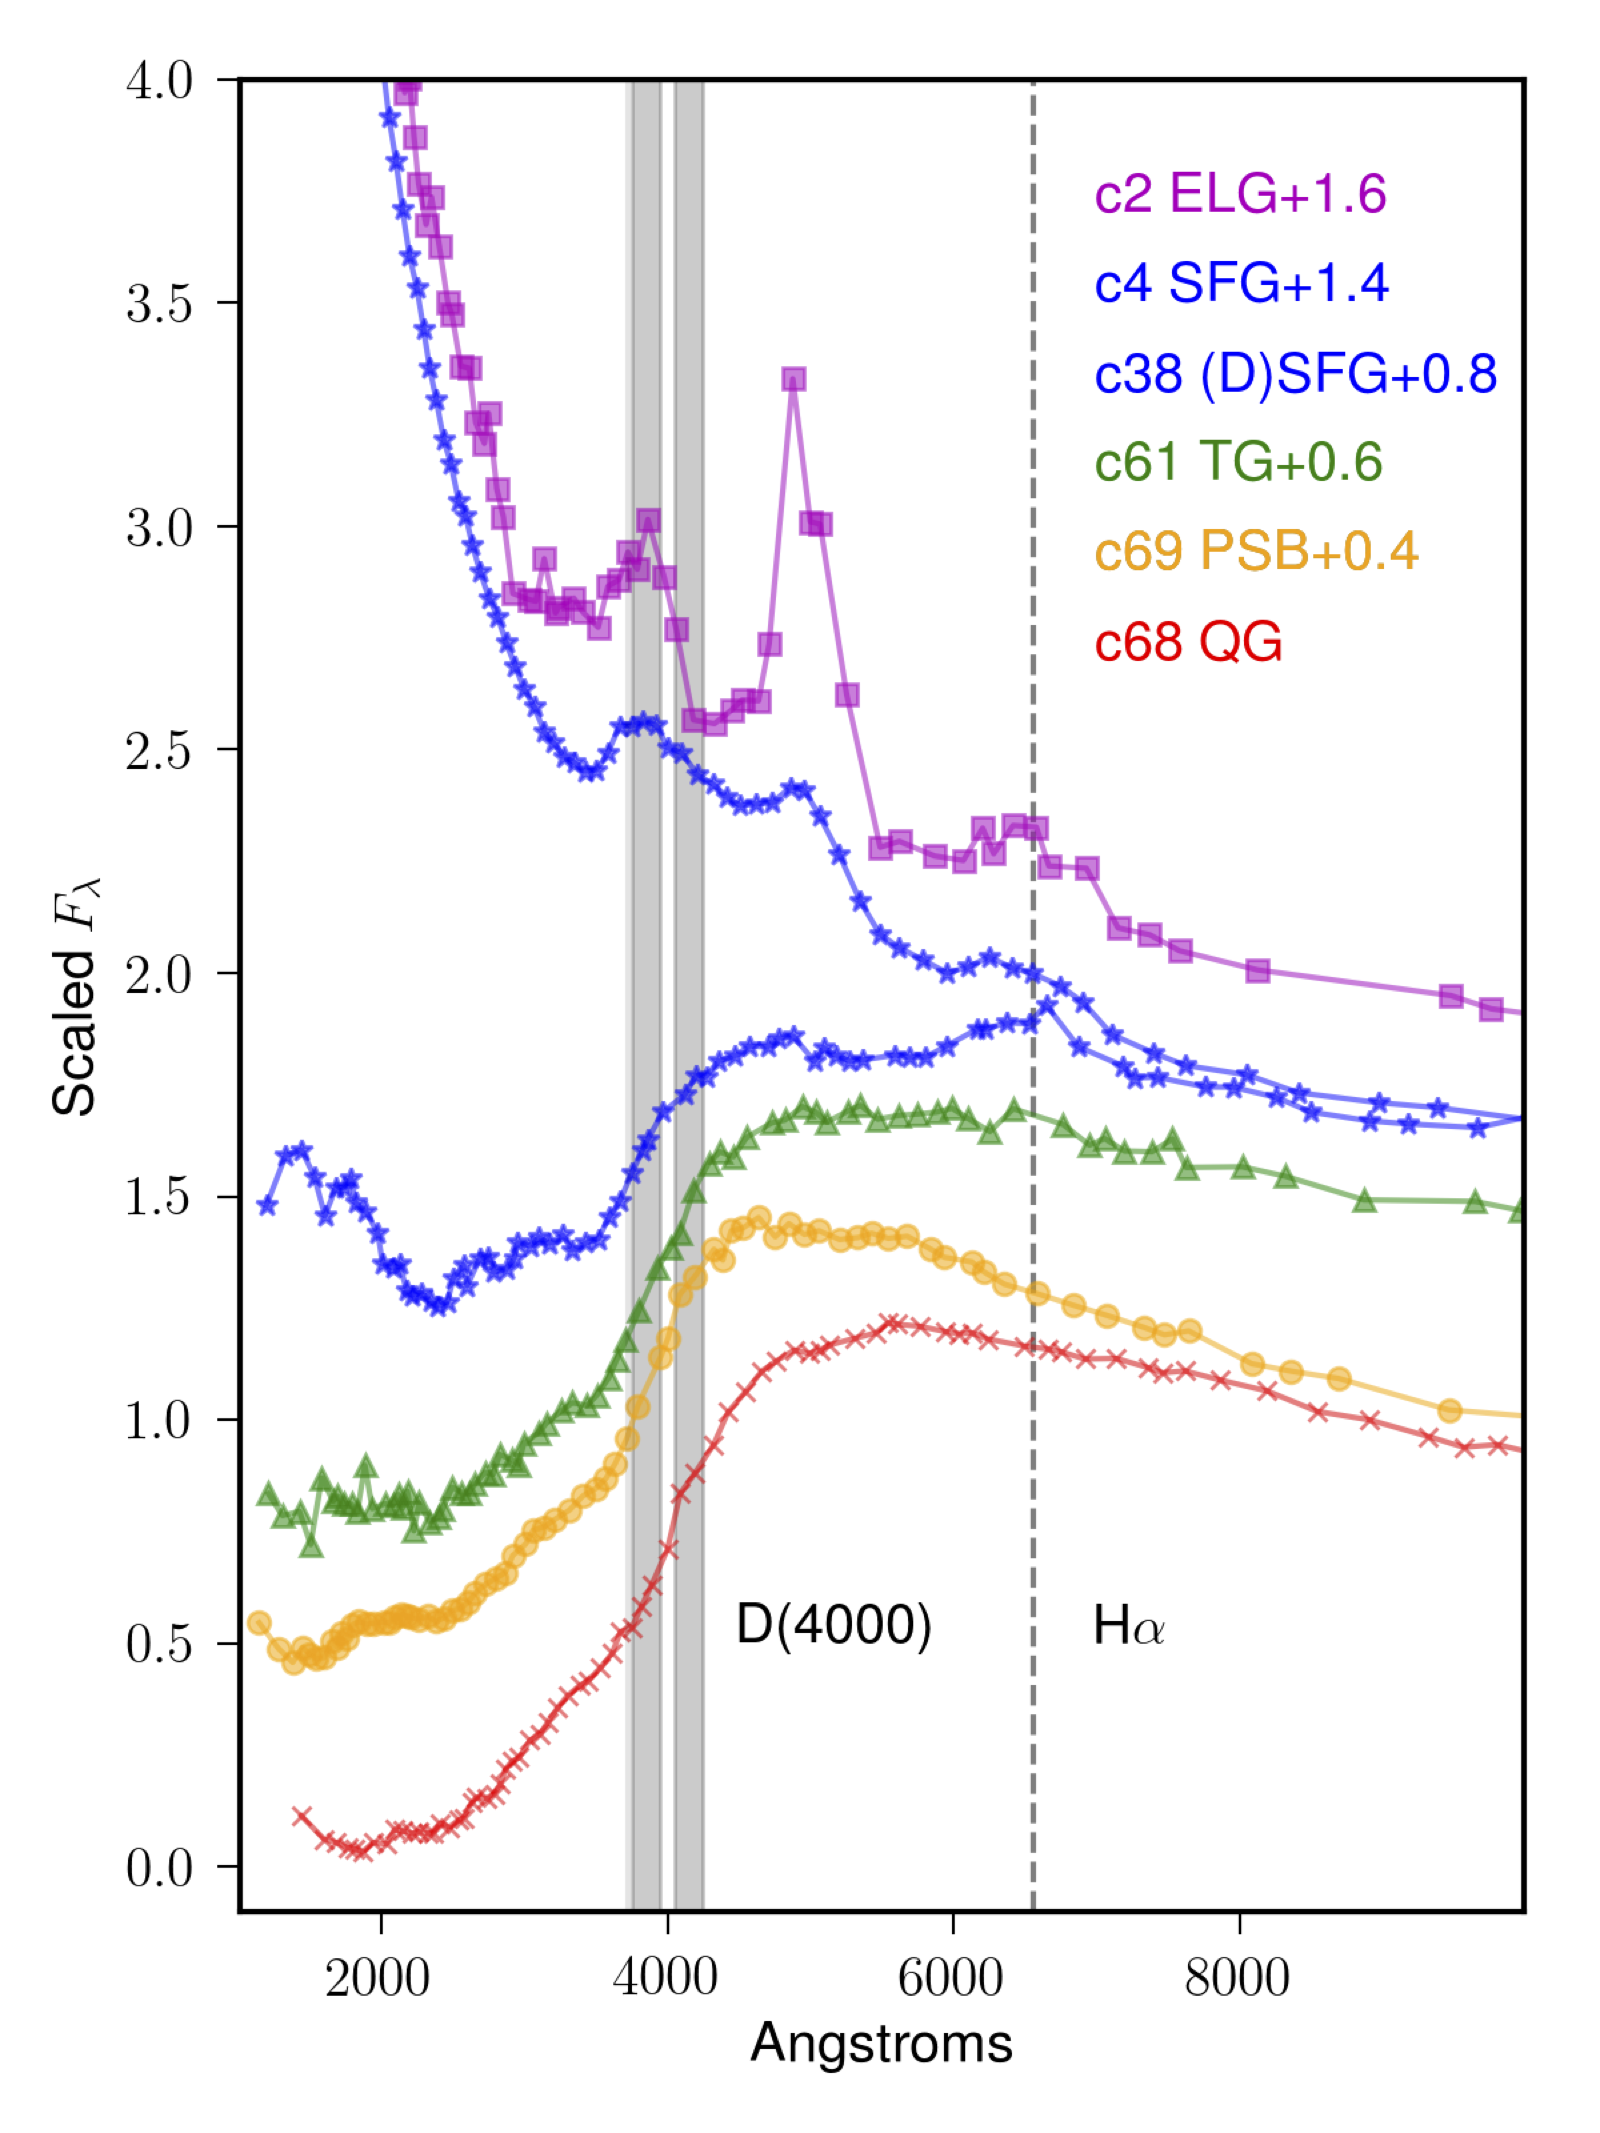
 Figure: Morphological characteristics of galaxies in different composite SED classes. Top: Sérsic indices for galaxies in our sample according to mass and classification, color-coded as in previous figures. Points are slightly offset along the abscissa for clarity, and error bars show the 16%–84% range in values for analog galaxies in composite SEDs of the class and binned mass range. Bottom: size–mass plane for galaxies in our composite SEDs. The SF galaxies follow the size–mass relations from Allen et al. (2017) (thickgrayline) quite well, while at 1 < z < 3 all other classes are smaller in size for a given mass (left). At 2.5 < z < 4 (right), the ELGs have similar sizes, while PSBs are smaller. In both cases, the non-star-forming classes lie near the compactness selection criterion of Barro et al. (2013), shown as a dashed line.
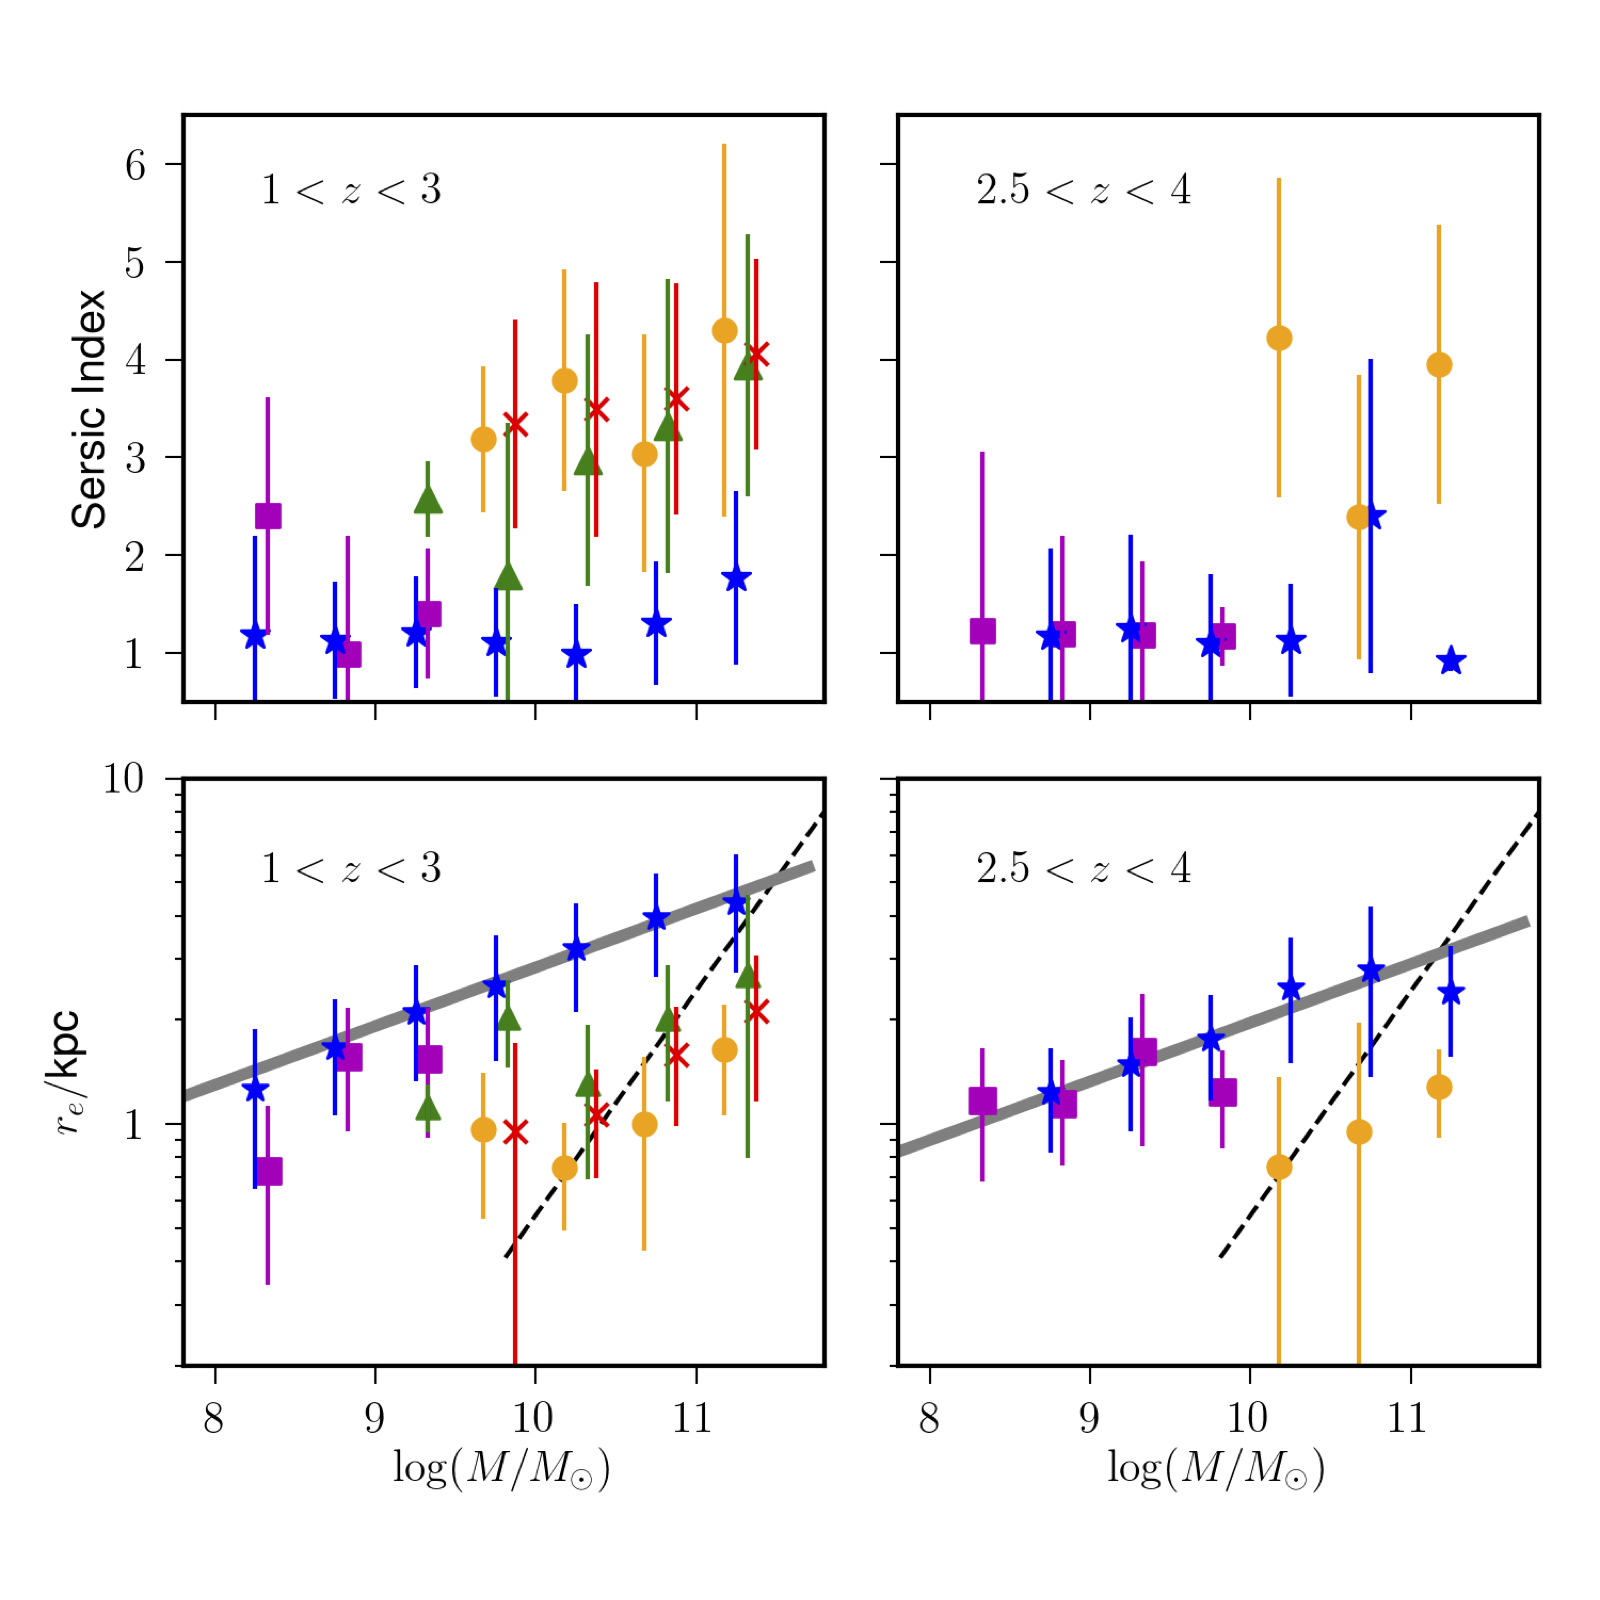 Figure: Comoving number densities of QGs (red), PSBs (orange), TGs (green), and mass-matched SFGs (blue) against redshift. Our results are consistent with the results from Wild et al. (2016), shown as hatched shaded regions. Results from NMBS (Whitaker et al. 2012a) are shown as non-hatched shaded regions. Notably, the shapes of the TG and QG curves appear quite similar, which is suggestive of them being along a similar evolutionary pathway. While both these tracks flatten out toward lower redshifts, the PSBs show strong evidence for a turnover around z ∼ 1.5.