
Search Results for:

Papovich 2018 Summary
Studies show the rate of quenching and the quiescent galaxy fraction are correlated with both increasing stellar mass and local environment. In the local Universe, these effects may be separable but in the more distant Universe, the evidence suggests otherwise. With ZFOURGE we studied the effects of galaxy environment on the evolution of the stellar–mass function (SMF) over 0.2<z<2.0 using=”” the=”” fourstar=”” galaxy=”” evolution=”” (zfourge)=”” survey=”” and=”” newfirm=”” medium–band=”” (nmbs)=”” down=”” to=”” stellar–mass=”” completeness=”” limit,=”” logm∗=”” m⊙=””> 9.0 (9.5) at z = 1.0 (2.0). We compared the SMFs for quiescent and star–forming galaxies in the highest and lowest environments. For star–forming galaxies, at all redshifts there are only minor differences with environment in the shape of the SMF. For quiescent galaxies, the SMF in the lowest densities shows no evolution with redshift, other than an overall increase in number density (φ∗) with time. This suggests that the stellar–mass dependence of quenching in relatively isolated galaxies is both universal and does not evolve strongly.</z<2.0>
While at z>1.5 the SMF of quiescent galaxies is indistinguishable in the highest and lowest densities, at lower redshifts it shows a rapidly increasing number density of lower–mass galaxies, logM∗/M⊙ = 9 − 10. This evolution can account for all the redshift evolution in the shape of the total quiescent–galaxy SMF. For quiescent galaxies, the SMF at higher redshift (z > 1) requires an environmental–quenching efficiency that decreases with decreasing stellar mass at 0.5 < z < 1.5 or it would overproduce the number of lower–mass quiescent galaxies in denser environments. This favors a dominant environment process such as starvation combined with rapid gas depletion and ejection at z > 0.5 − 1.0 for galaxies in our mass range (similar to “overconsumption” models). The efficiency of this process decreases with redshift allowing other processes (such as galaxy interactions and ram–pressure stripping) to become more important at later times, z < 0.5.
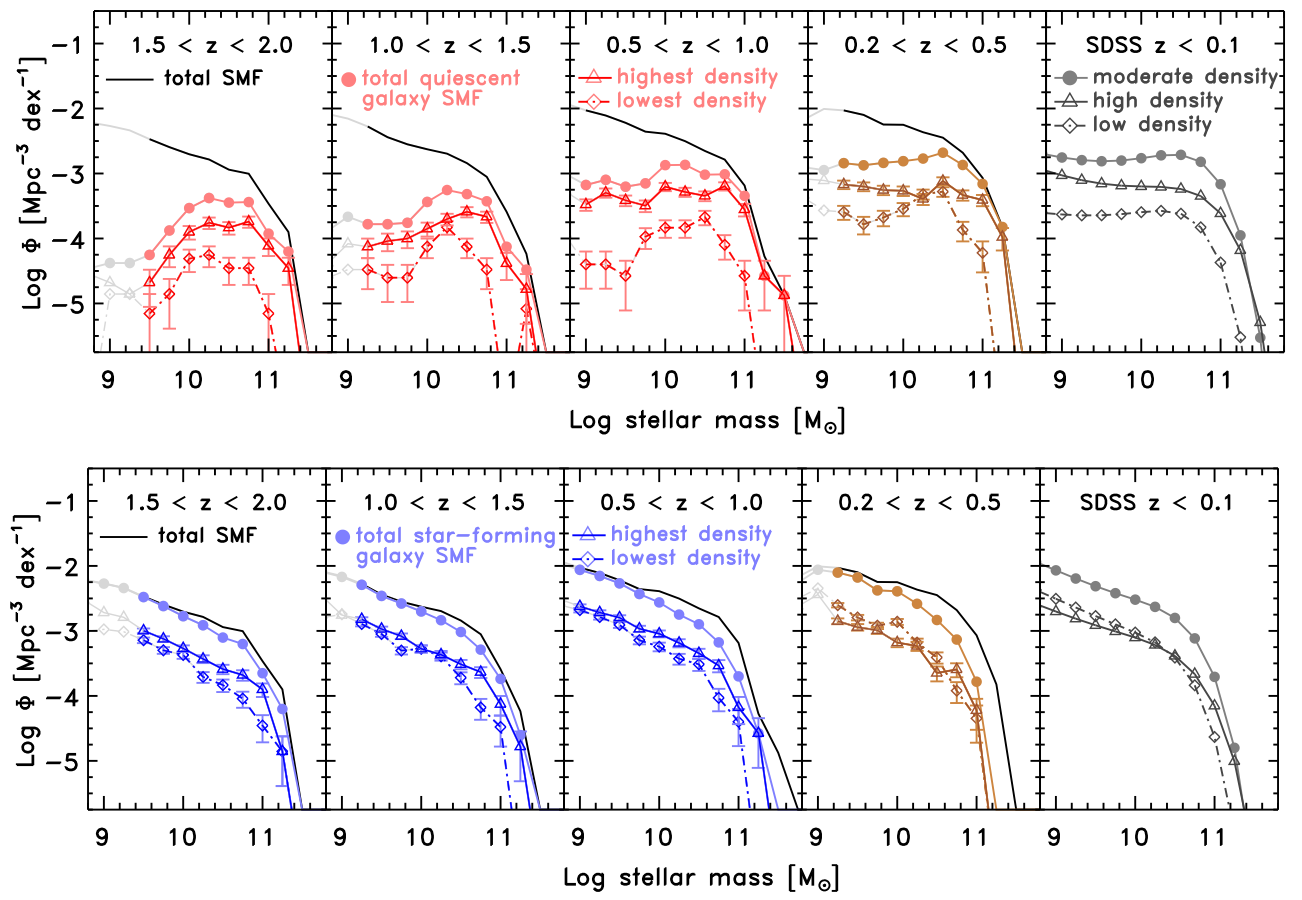
Figure. Evolution of the Stellar Mass Function (SMF) for quiescent and star-forming galaxies from the ZFOURGE survey (0.5 < z < 2.0) and NMBS (0.2 < z < 0.5). All panels show the total galaxy SMF (solid black line) as a function of redshift, as labeled. The top row of panels shows the evolution of the SMF for all quiescent galaxies, and for quiescent galaxies in the highest density quartile (D4) and lowest density quartile (D1), as labeled. The bottom row of panels shows the evolution of the SMF for all star-forming galaxies and for star-forming galaxies in D4 and D1, as labeled. Light-gray shaded points and lines show where the data fall below the stellar mass completeness for the redshifts of each panel. Error bars correspond only to Poissonian uncertainties using the number of galaxies in each data point. The right-most panels in each row show SMFs from SDSS at z < 0.1 derived in high densities, moderate densities, and low densities (Baldry et al. 2006), scaled to match the normalization of our SMFs derived from the NMBS at 0.2 < z < 0.5 (see text). The SMF for quiescent galaxies shows a dependence on density while there is no such strong dependence for the SMF of star-forming galaxies.
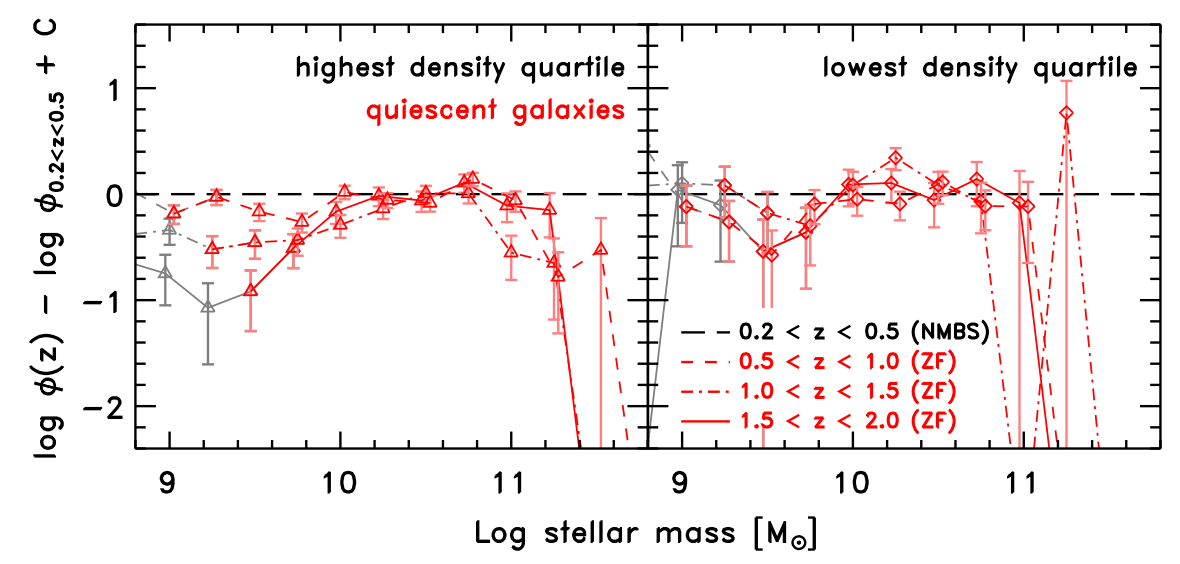
Figure. Relative evolution of the SMF for quiescent galaxies as a function of environment. The left panel shows the ratio of the SMF for quiescent galaxies in the highest density quartile (D4) in each redshift bin to the SMF for quiescent galaxies in the highest density quartile at 0.2 < z < 0.5 (the constant C acts to normalize each SMF to the same number density at logM∗/M⊙=10.6). The right panel shows the same for quiescent galaxies in the lowest density quartile (D1) The gray-shaded points and lines show data below the stellar mass completeness limit. There is no evidence that the shape of the SMF evolves for quiescent galaxies in the lowest–density quartile. In contrast, in the highest density quartile, there is rapid redshift evolution in the SMF, particularly in the relative number density of low-mass quiescent galaxies.
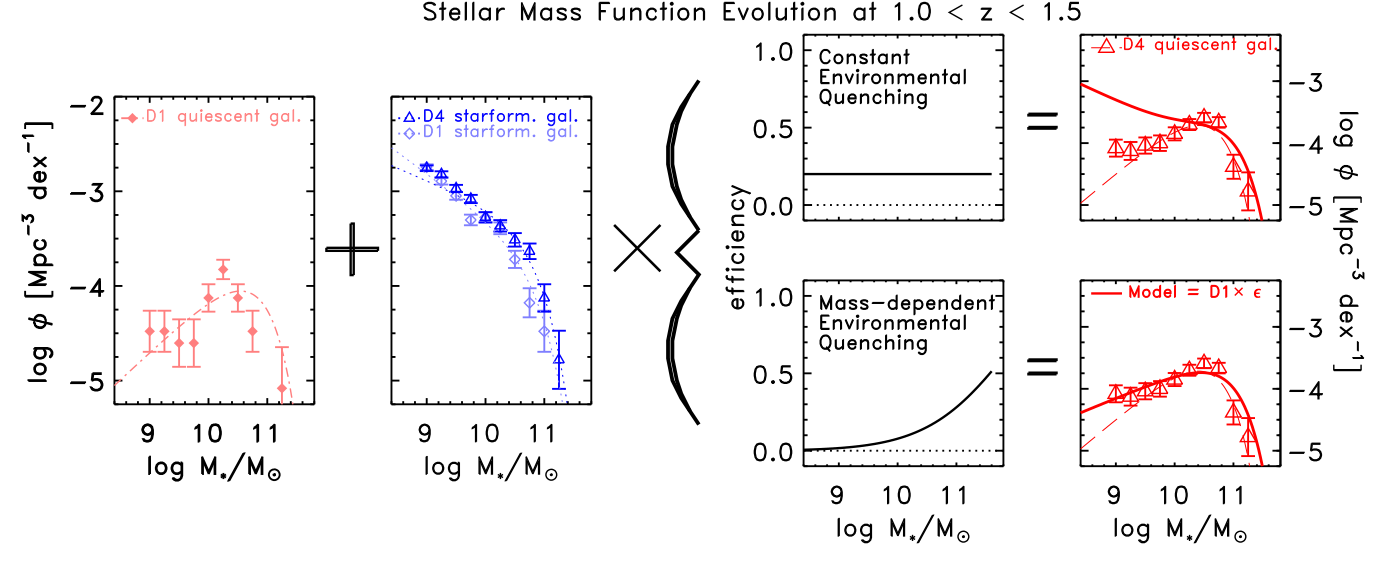
Figure. Simple experiments of the evolution of the stellar-mass function (SMF) of quiescent galaxies at 1.0 < z < 1.5 in different environments. The models demonstrate that the environmental quenching must be dependent on the stellar mass to reproduce the SMF of quiescent galaxies in different environments. The panels demonstrate an “equation”, with some fraction of star-forming galaxies being quenched by the environment and added to the quiescent–galaxy SMF in the lowest density quartile (D1) to represent the quiescent–galaxy SMF in the highest density quartile (D4), as described in Eq. 5 and 6. The left panels show the measured SMF and Schechter-model fit for quiescent and star-forming galaxies in the lowest overdensity quartile (D1) and the highest overdensity quartile (D4), as labeled. The right-hand panels show results derived by adding quenched star-forming galaxies using different environmental quenching efficiencies. The lower row of panels show an environmental quenching efficiency that depends on stellar mass from Kawinwanichakij et al. (2017), and the upper panels show results derived using an environmental quenching efficiency that is constant with stellar mass (with values from Peng et al. 2010; Kovaˇc et al. 2014). A mass-independent environmental quenching efficiency would greatly overproduce the number density of low-mass, quiescent galaxies in high overdensities at z > 0.5. The environmental quenching efficiency must decline with decreasing stellar mass at these redshifts.

Cowley 2018 Summary
We investigate the SMBH-galaxy connection by tracking the mean black hole accretion rate (BHAR) and mean star formation rate (SFR) of a sample of galaxies out to z = 2:5. We perform X-ray stacking and SED decomposition to estimate BHARs and SFRs. While such studies are prevalent, they are often limited to AGN-selected or mass-limited samples, which contain a broad mixture of galaxies with different evolutionary histories. To address this, we use the ZFOURGE catalogues to construct two independent samples based on the mass-progenitors of the present-day Milky Way (MW) and Andromeda galaxy (M31).
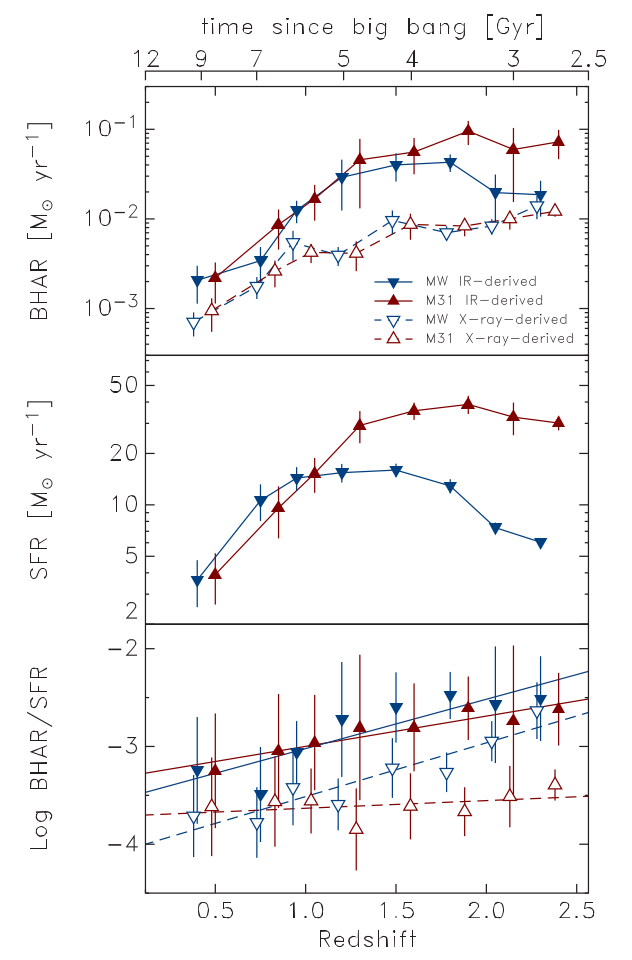
Top panel: The mean BHAR as a function of redshift for our MW- (blue; down triangles) and M31-mass (red; up triangles) progenitors. Vertical errors represent errors on the mean. A slight offset in redshift is applied for clarity. Middle panel: the mean SFR as a function of redshift for our progenitors (same symbols as top panel). Bottom panel: the mean BHAR to SFR ratio as a function of redshift for our progenitors (same symbols as top panel). The solid lines indicate a least-squares linear fit to these data. With the exception of the X-ray derived M31 progenitors (which are believed to be impacted by obscuration), we find an evolving BHAR/SFR ratio for the bulk of our sample. This result contrasts previous work (Calhau et al., 2017; Mullaney et al., 2012b; Dai et al., 2015), which tends to find a nearly flat BHAR/SFR ratio across cosmic time. A flat correlation is often explained by a simple scenario where a joint fuelling process regulates both SMBH growth and star formation (see Mullaney et al., 2012b).
In contrast to past work, our results show an evolutionary disconnect between the BHAR and SFR of our progenitor samples. This apparent difference illustrates the importance of selecting progenitor samples when looking for evolutionary changes in AGN. Indeed, mass-limited, star-forming or X-ray selected samples may not capture underlying evolutionary trends because they contain galaxies with very different evolutionary paths. The present work directly addresses this by adopting a selection that attempts to account for the mass growth of galaxies over the redshift range considered here.
Furthermore, we find the decline of the mean BHARs and SFRs with decreasing redshift casts doubts over the suppression of star formation being predominantly driven by luminous AGN feedback (i.e. high BHARs) in MW- and M31-mass progenitors. While one may expect to see an increase in BHARs during a period of quenching, we instead find that the rate at which the progenitors quench is decoupled from the BHARs, which decline over similar timescales.
Top panel: the evolution of the quiescent fraction for our MW- (blue; down triangles) and M31-mass (red; up triangles) progenitors as a function of redshift. We apply a slight offset in redshift for clarity. Vertical errors represent the binomial confidence interval. Bottom panel: the evolution of the quenching rate for our progenitors (same symbols as top panel). There is no evidence the evolving quenching rate is linked to the evolving BHAR.

Kawinwanichakij 2017 Summary
In the low redshift Universe (z ~ 0.1), it has been shown that the respective relationships between stellar mass and environment on quenching are largely separable, implying there are two distinct quenching processes at work: one that correlates with stellar mass (independent of environment) and one that correlates with galaxy environment (independent of stellar mass). With ZFOURGE we quantify the environmental quenching efficiency, and show that at z > 0.5 it depends on galaxy stellar mass, demonstrating that the effects of quenching related to (stellar) mass and environment are not separable. In high-density environments, the mass and environmental quenching efficiencies are comparable for massive galaxies (log(M/M⊙) > 10.5) at all redshifts. For lower mass galaxies (log(M/M⊙) ~ 9-10), the environmental quenching efficiency is very low at z > 1.5, but increases rapidly with decreasing redshift. Environmental quenching can account for nearly all quiescent lower mass galaxies (log(M/M⊙ ) ~ 9–10), which appear primarily at z < 1.0.
The morphologies of lower mass quiescent galaxies are inconsistent with those expected of recently quenched star-forming galaxies. Some environmental process must transform the morphologies on similar timescales as the environmental quenching itself. The evolution of the environmental quenching favors models that combine gas starvation (as galaxies become satellites) with gas exhaustion through star-formation and outflows (“overconsumption”), and additional processes such as galaxy interactions, tidal stripping, and disk fading to account for the morphological differences between the quiescent and star-forming galaxy populations.
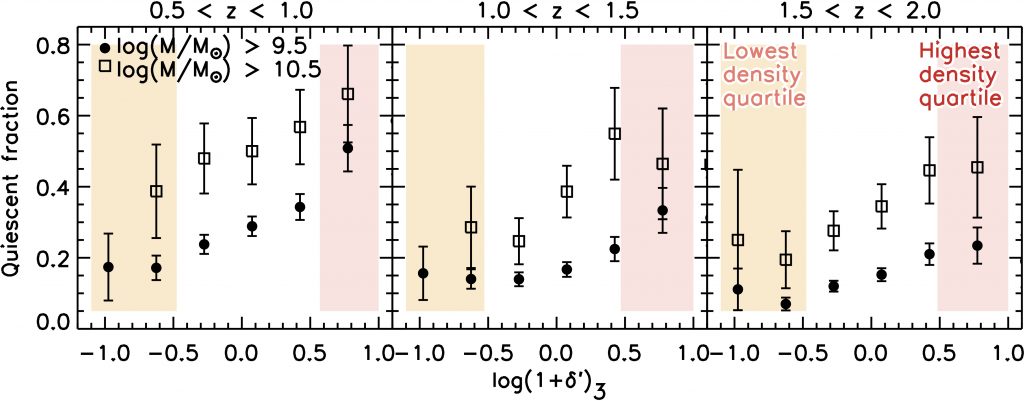
Figure. Quiescent fraction versus overdensity in three different redshift ranges for two mass-selected samples. The quiescent fractions of galaxies are determined in bins of 0.4 dex of log(1 + δ). The error bars indicate 1σ uncertainties based on Poisson statistics. The shaded regions in each panel indicate the lower and upper 25th percentiles of log(1 + δ), where we define low- and high-density environments. At all redshift ranges, we see evidence for a higher quiescent fraction of galaxies at higher densities. This effect is very strong at z < 1, but decreases at higher redshift, z > 1.
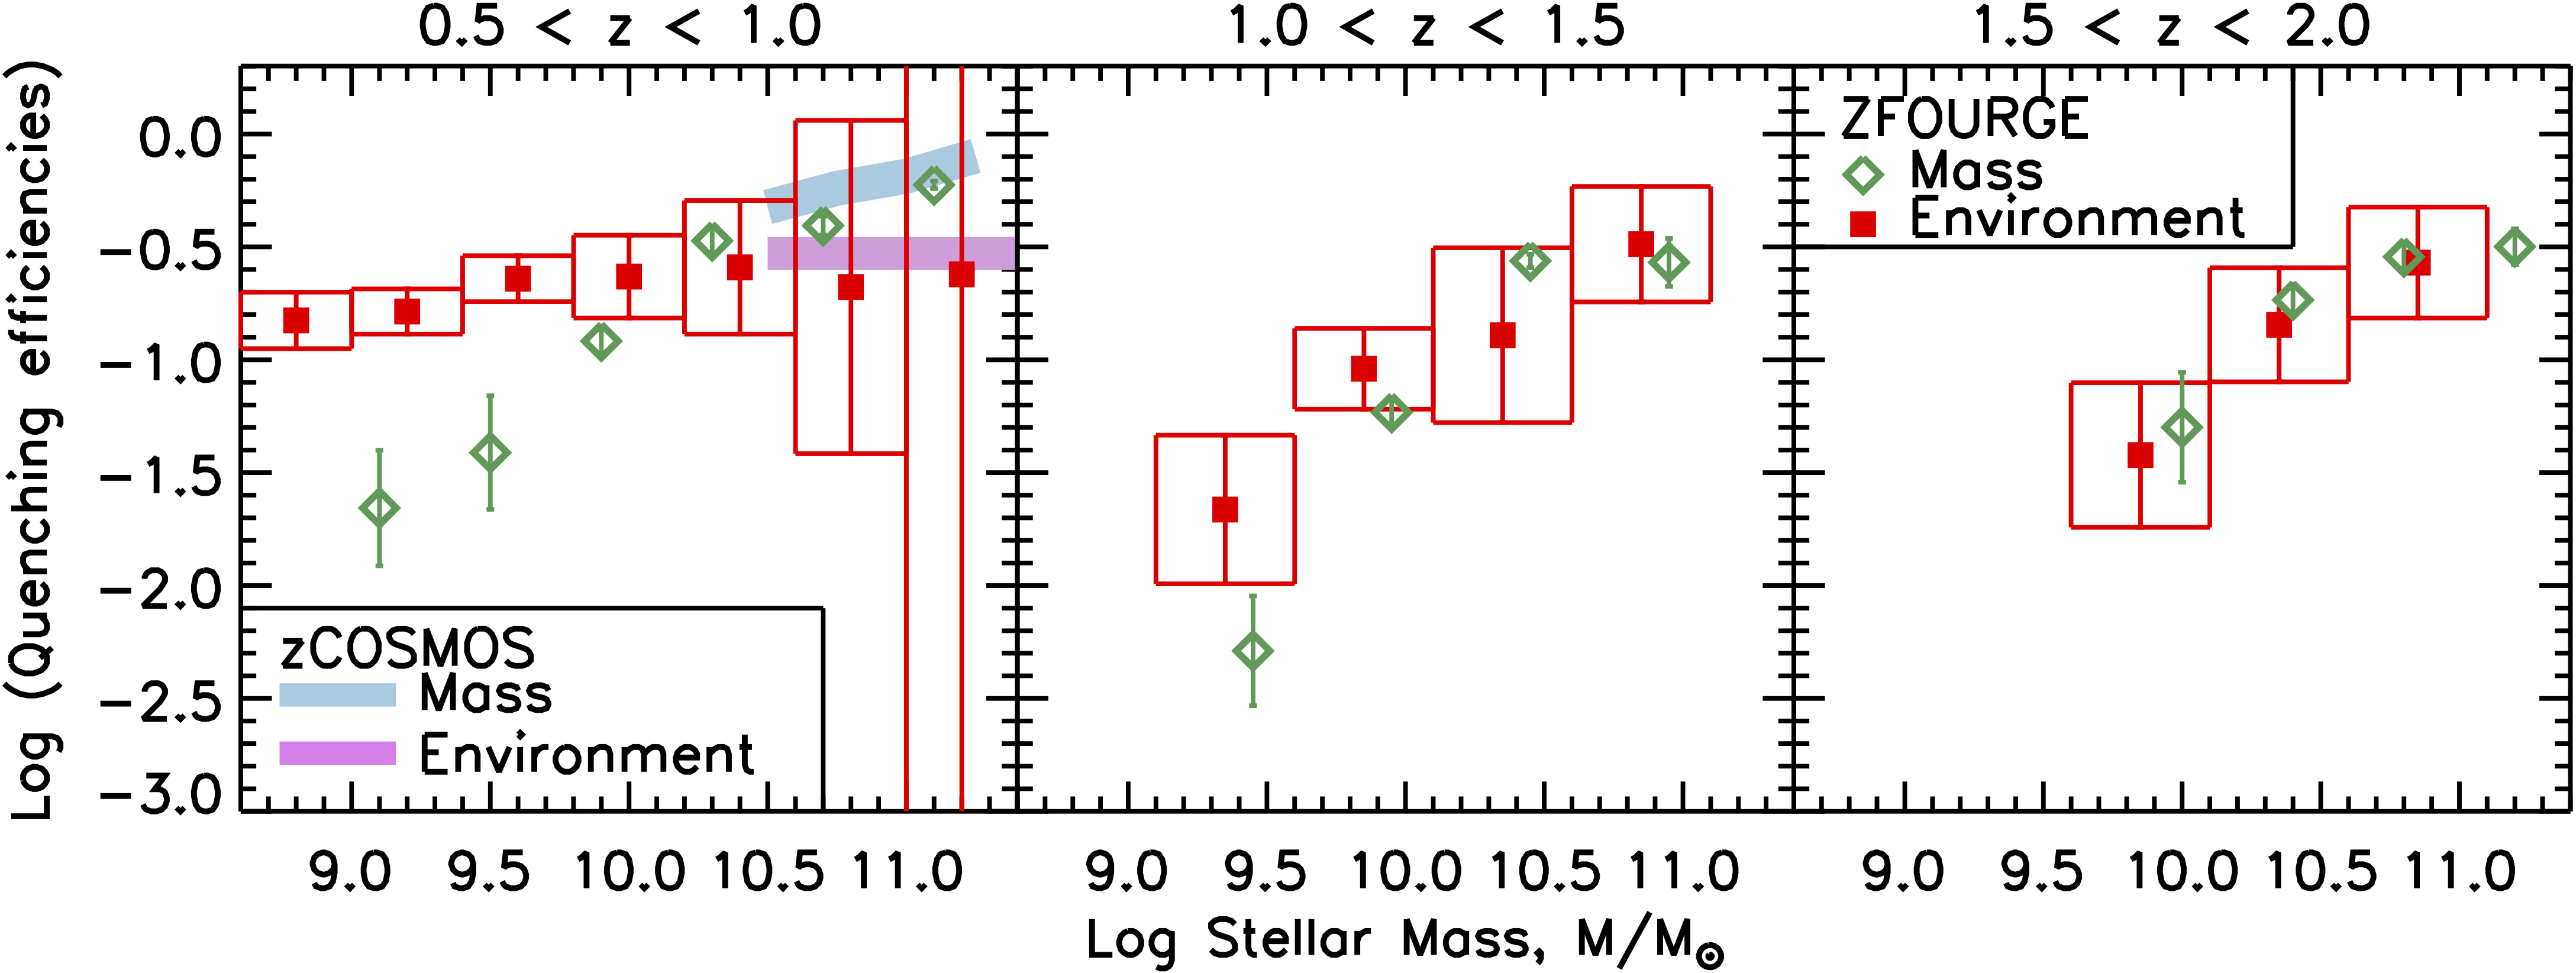
Figure. The comparison between the environmental quenching efficiency (red squares) and (stellar) mass quenching efficiency (green diamond) as a function of stellar mass for galaxies in three redshift ranges. The environmental quenching efficiencies shown here correspond to the highest overdensity quartiles. The box widths show the stellar mass binning, and the box heights (and error bars) indicate 1σ Poisson uncertainties. The purple and light blue rectangles show the environmental and (stellar) mass quenching efficiencies, respectively, measured in zCOSMOS at 0.3 < z < 0.6 (Peng et al. 2010). The environmental quenching efficiency evolves with both cosmic time and galaxy stellar mass. At z < 1, the environmental quenching is largely independent of the galaxy stellar mass. At z > 1, more massive galaxies experience stronger environmental quenching, indicating that the effects of stellar mass and environment on galaxy quenching are not separable at high redshift.
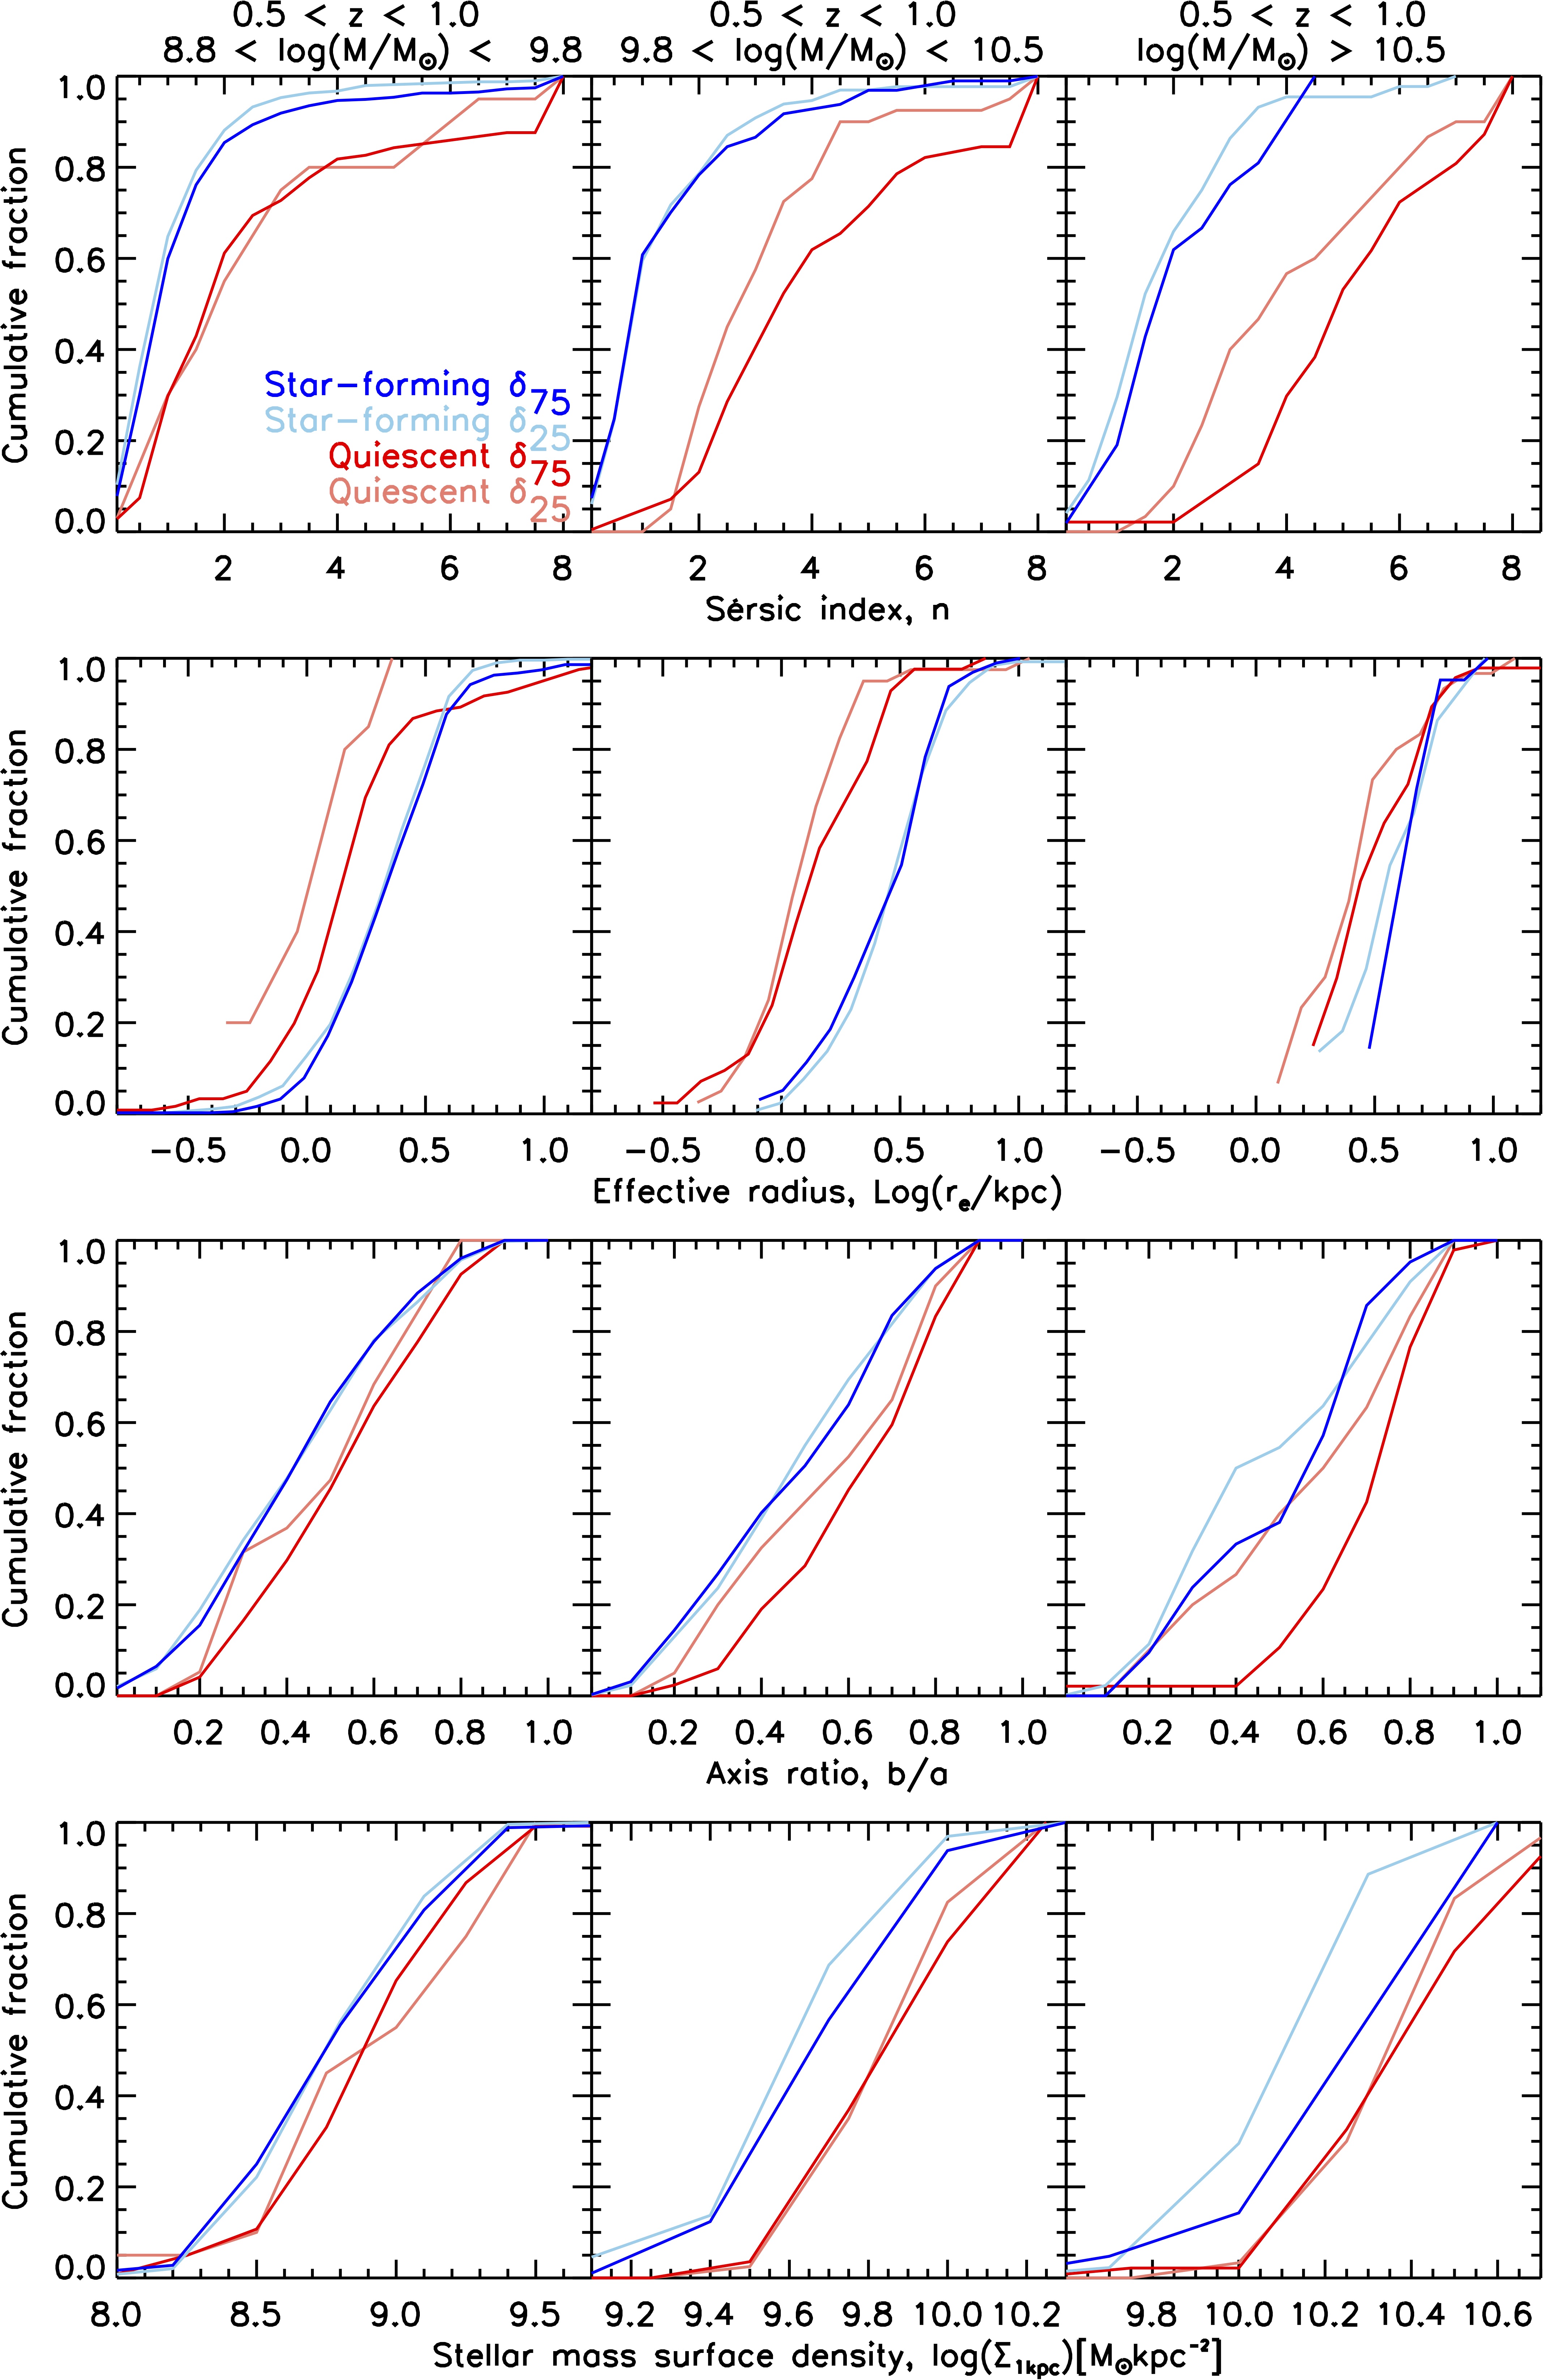
Figure. The cumulative distribution of Sérsic index (top row), effective radius (second row), axis ratio (third row), and stellar mass surface density in inner 1 kpc (bottom row) for quiescent galaxies in the lowest-density quartile (δ25; light-red), quiescent galaxies in the highest-density quartile (δ75; red), star-forming galaxies at 0.5 < z < 1.0 in the lowest-density quartile (δ25; light blue), and star-forming galaxies in the highest-density quartile (δ75; blue) in three stellar mass ranges. No significant evidence for a difference in distributions of any of the four morphological parameters between quiescent (and star-forming) galaxies in low- and high-density environment, except for the effective radius distributions of low-mass quiescent galaxies and Sérsic index distributions of high-mass quiescent galaxies but only at 2σ level significance.


Forrest 2017 Summary
10We construct a set of composite spectral energy distributions (SEDs) from ZFOURGE galaxies in 2.5<z<4.0 and SNR<20 (and removing those with evidence of active galactic nuclei). Included are two composite SEDs comprised of galaxies with particularly strong nebular emission features. The SEDs of these galaxies are consistent with young, blue, vigorously star-forming galaxies, analogous to those believed to play a role in the epoch of reionization. In contrast to the local universe, these extreme emission line galaxies dominate the bluest galaxies as measured by UV slope.
Fitting the stellar continuum in several ways, we find these galaxies have [OIII]+Hβ emission equivalent widths of around 800Å in the rest-frame. This is consistent with many other studies of these extreme emitters.
![Discovery of Extreme [O III]+Hβ Emitting Galaxies Tracing an Overdensity at z ∼ 3.5 in CDF-South](/wp-content/uploads/sites/8/2020/06/forrest2017_fig1.jpg)
Additionally, the composite SEDs bring to light an overdensity of galaxies in CDFS at z=3.47, which includes 5 spectroscopically confirmed members (green). The below figure is colored by the overdensity relative to the mean density in the field. This is determined by calculating the 7th nearest neighbor metric for all galaxies with 3.42<z_phot<3.56. One sigma overdensity contours are in yellow, while five sigma overdensity contours are in orange.
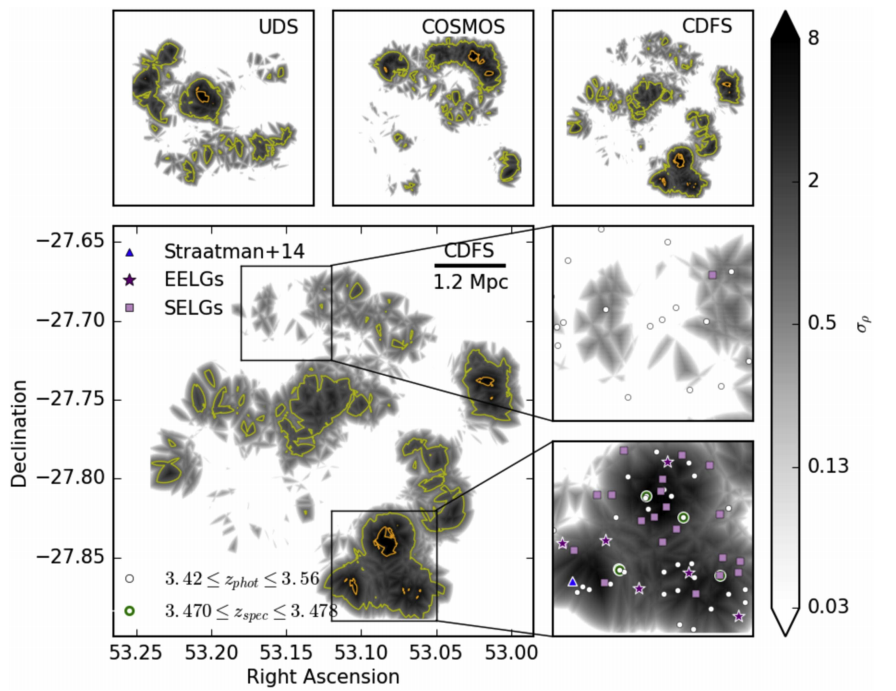
For comparison, the largest one sigma overdensities in CDFS, COSMOS, and UDS encapsulate ~50, ~30, and ~10 galaxies, respectively. Those with strong emission are shown in purple in the lower right panel.

