Tomczak 2016 Summary
Tomczak et al. 2016 Summary: We explore star-formation histories (SFHs) of galaxies based on the evolution of the star-formation rate stellar mass relation (SFR-M*) at 0.5 < z < 4. We find that the SFR-M* relation is not consistent with a single power-law of the form SFR ~ M*a at any redshift; it has a power-law slope of a ~ 1 at low masses, and becomes shallower above a turnover mass (M0) with evidence that M0 increases with redshift. We use the evolving SFR-M* sequence to generate SFHs, finding that typical SFRs of individual galaxies rise at early times and decline after reaching a peak. This peak occurs earlier for more massive galaxies. We integrate these SFHs to generate mass-growth histories and compare to the implied mass-growth from the evolution of the stellar mass function. We find that these two estimates are in broad qualitative agreement, but that there is room for improvement at a more detailed level.
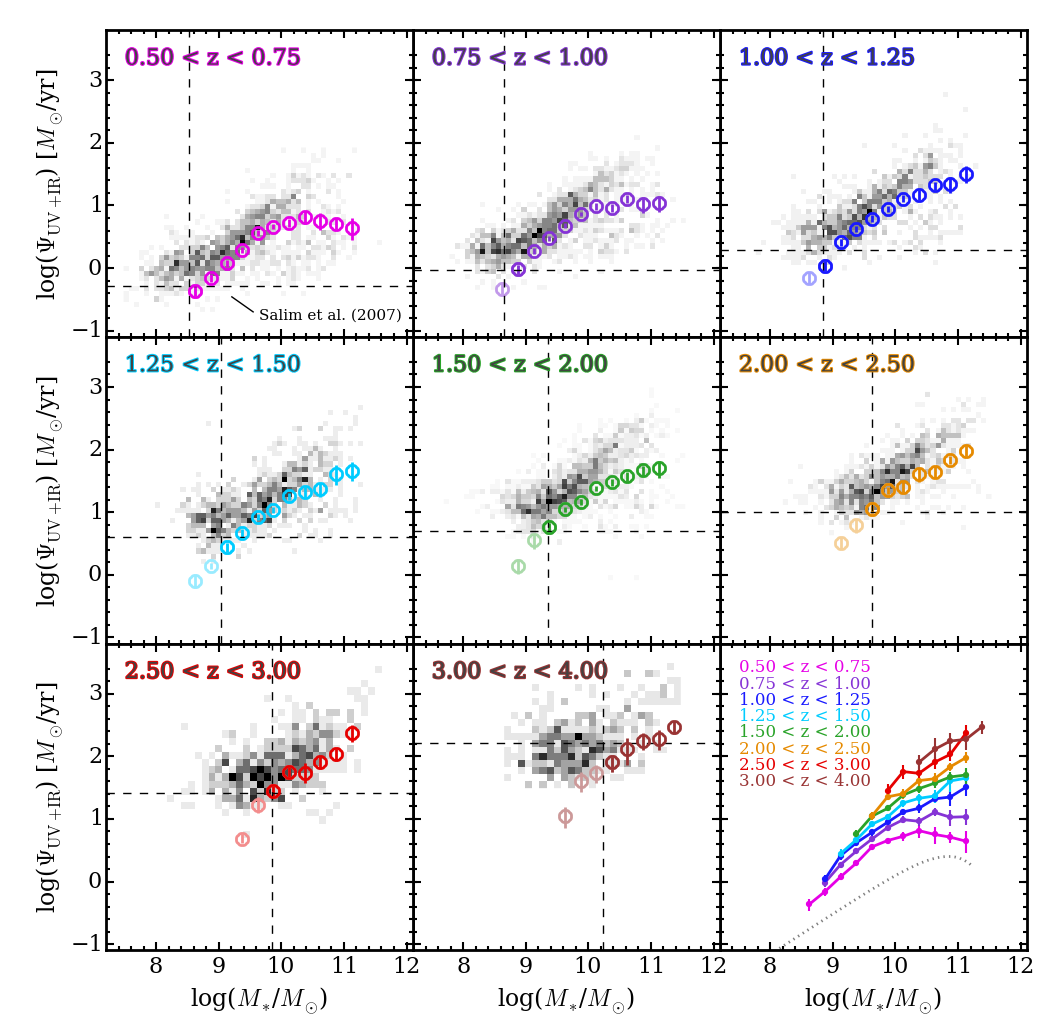
Star-formation rate vs. stellar mass relations for all galaxies. Gray-scale shows the distribution of 24um-detected galaxies whereas olored points represent SFRs based on our stacking analysis. Vertical and horizontal dashed lines show estimated mass-completeness limits and 24um detection limits for individual galaxies respectively. The dotted line is the z~0 measurement from Salim et al. (2007).
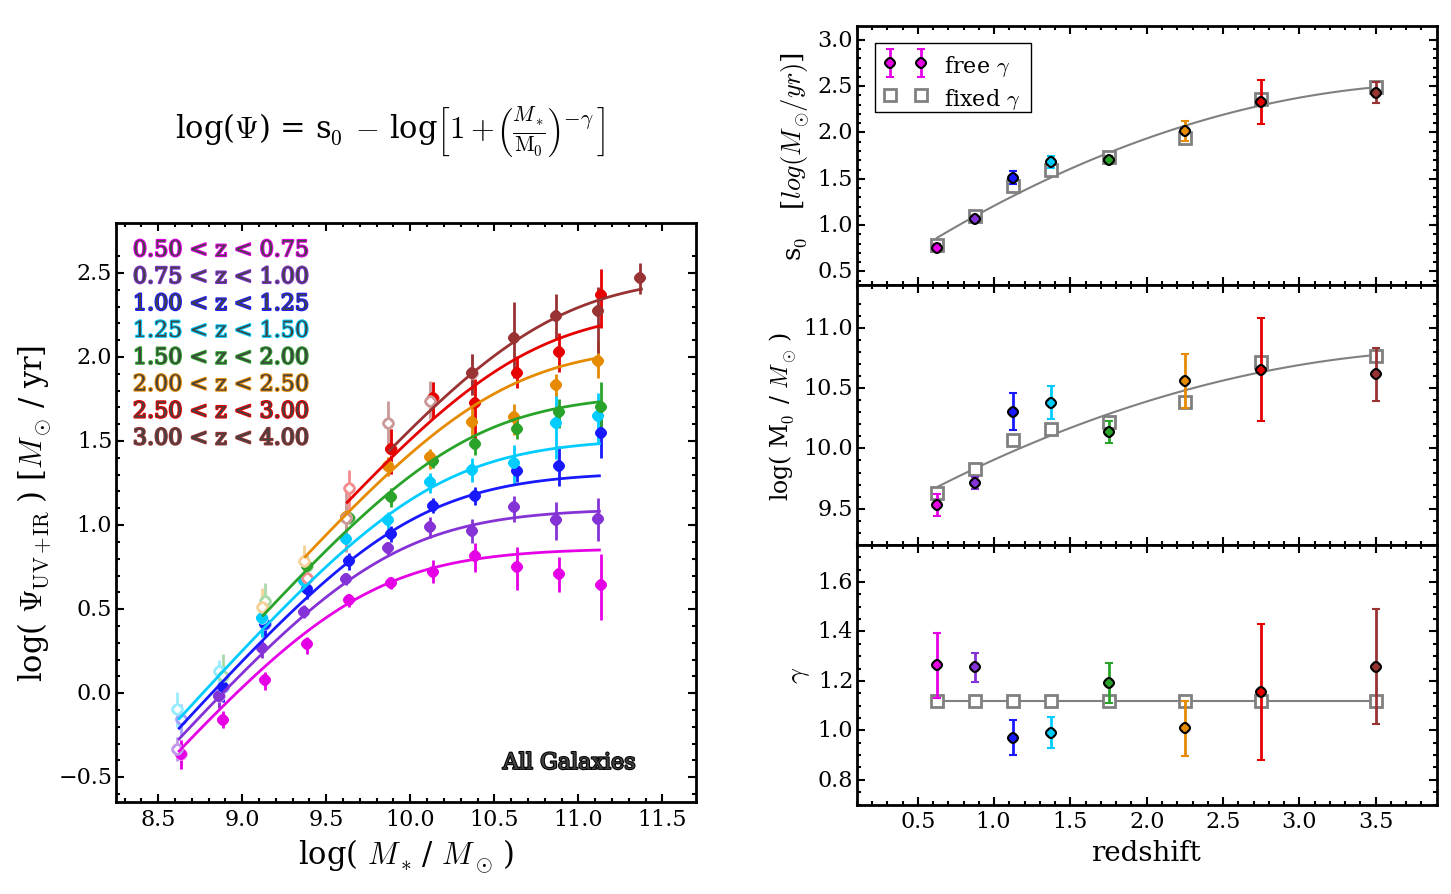
Parameterization for the redshift evolution of the SFR-M* sequence of all galaxies. We start with the equation proposed by Lee et al. (2015), shown in the upper left, which is described by three free parameters: a power-law of slope gamma at low masses which asymptotically approaches a peak star-formation rate s0 at high masses with M0 being the transition mass between the two behaviors. On the right we show these best-fitting parameters vs. redshift and results from the 2-pass fitting procedure. The panel on the left shows the the corresponding redshift-parameterized SFR-M* relations at the central redshift of each bin with points showing the measured SFR-M* relations.
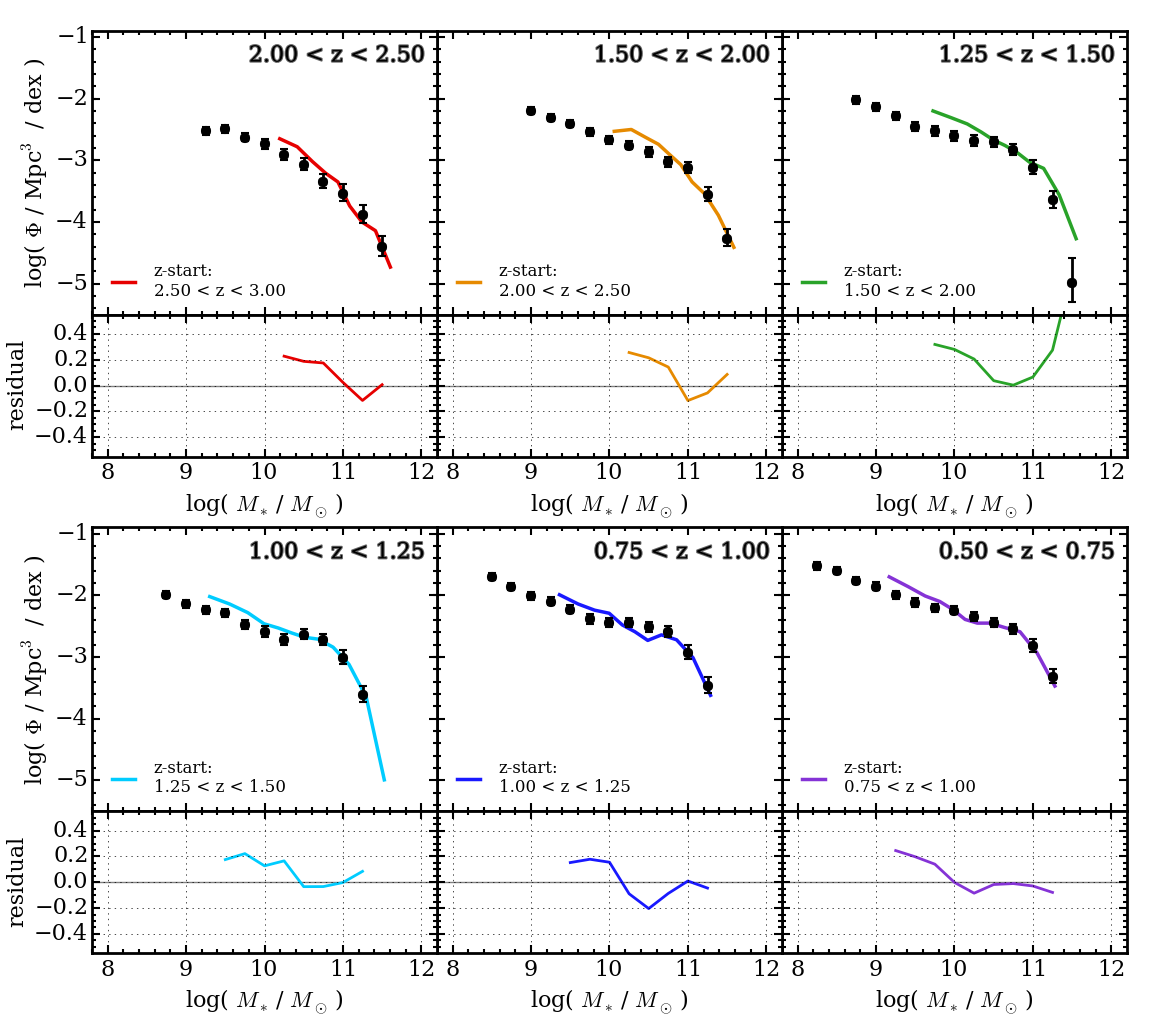
Implied growth of the galaxy stellar mass function due to star-formation. Each panel shows the observed SMF from Tomczak et al. (2014) at the redshifts indicated in the upper-right corner. Curves in each panel represent the SMF from the preceding redshift bin evolved forward in time based on our parameterized SFR-M* relation for all galaxies. Redshifts of the original SMFs (i.e. “starting” redshifts) are indicated in the legend. Residuals between the evolved and observed SMFs for each redshift bin are shown in the lower panels. We observe that the numbers of galaxies at M* < 1010.5 Msol are consistently overproduced at each redshift by ~0.2-0.3 dex. It is important to note that galaxy merging is not accounted for in the inferred SMFs, thus, at least part of this offset must be caused by this effect. However this would require a destruction rate between 25-65% of these galaxies per Gyr, which substantially exceeds current estimates of galaxy merger rates (e.g. Lotz et al. 2011, Williams et al. 2011, Leja et al. 2015).

Differential SFHs and mass-growth profiles extracted from the evolution of the SFR-M* relation of all galaxies. Star symbols indicate four arbitrary sets of initial conditions consistent with our SFR-M* relations. Hatched regions in the middle panel show the inferred growth profiles generated by mapping the predicted number density evolution of these galaxies to the observed stellar mass function. Although there is broad agreement between these two techniques, we note that the integrated mass-growth curves are more accelerated, growing more rapidly at early times and slowing to lesser rates at later times. This is shown clearly in the right panel which plots the difference between the time derivatives of these two approaches.
