Tomczak 2014 Summary
Using data from the FourStar Galaxy Evolution Survey (ZFOURGE) and the Cosmic Assembly Near-IR Deep Extragalactic Legacy Survey (CANDELS) we have measured the galaxy stellar mass function (SMF) to a substantial depth for a mass-selected sample of galaxies. We find evidence for a steepening slope at the low-mass end of the SMF as early as z=2 (about 3.5 Gyr after the big bang). Furthermore, we reveal that the growth in the numbers of passively evolving galaxies since z=2 ranges from from factors of 5-25, much more dramatic than for star-forming galaxies which increase by only a factor of ~2 over the same epoch.
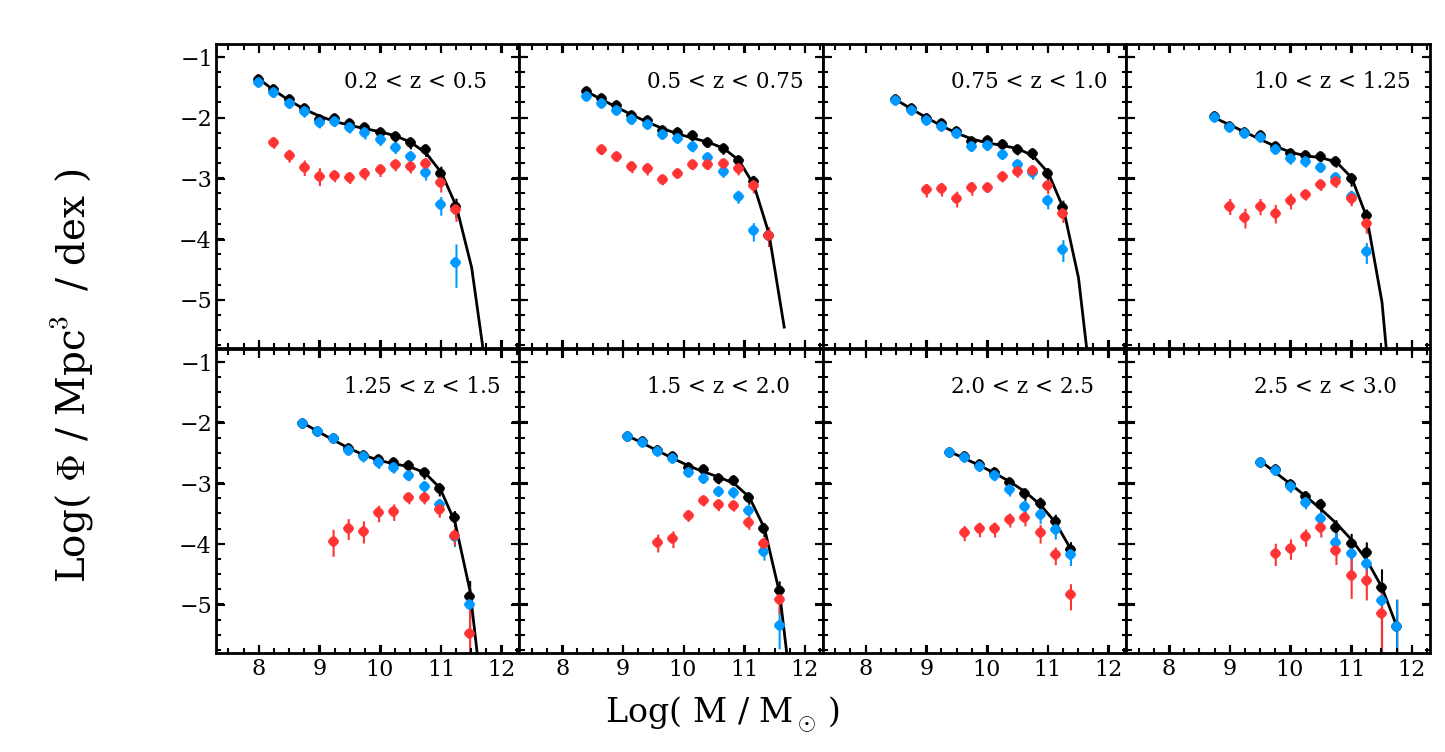
Stellar mass functions measured in various bins of redshift. Blue and red datapoints correspond to the separate SMFs of star-forming and quiescent galaxies respectively, with the black line and points representing the sum of both. Points are only shown above the mass-completeness limit of each sample.
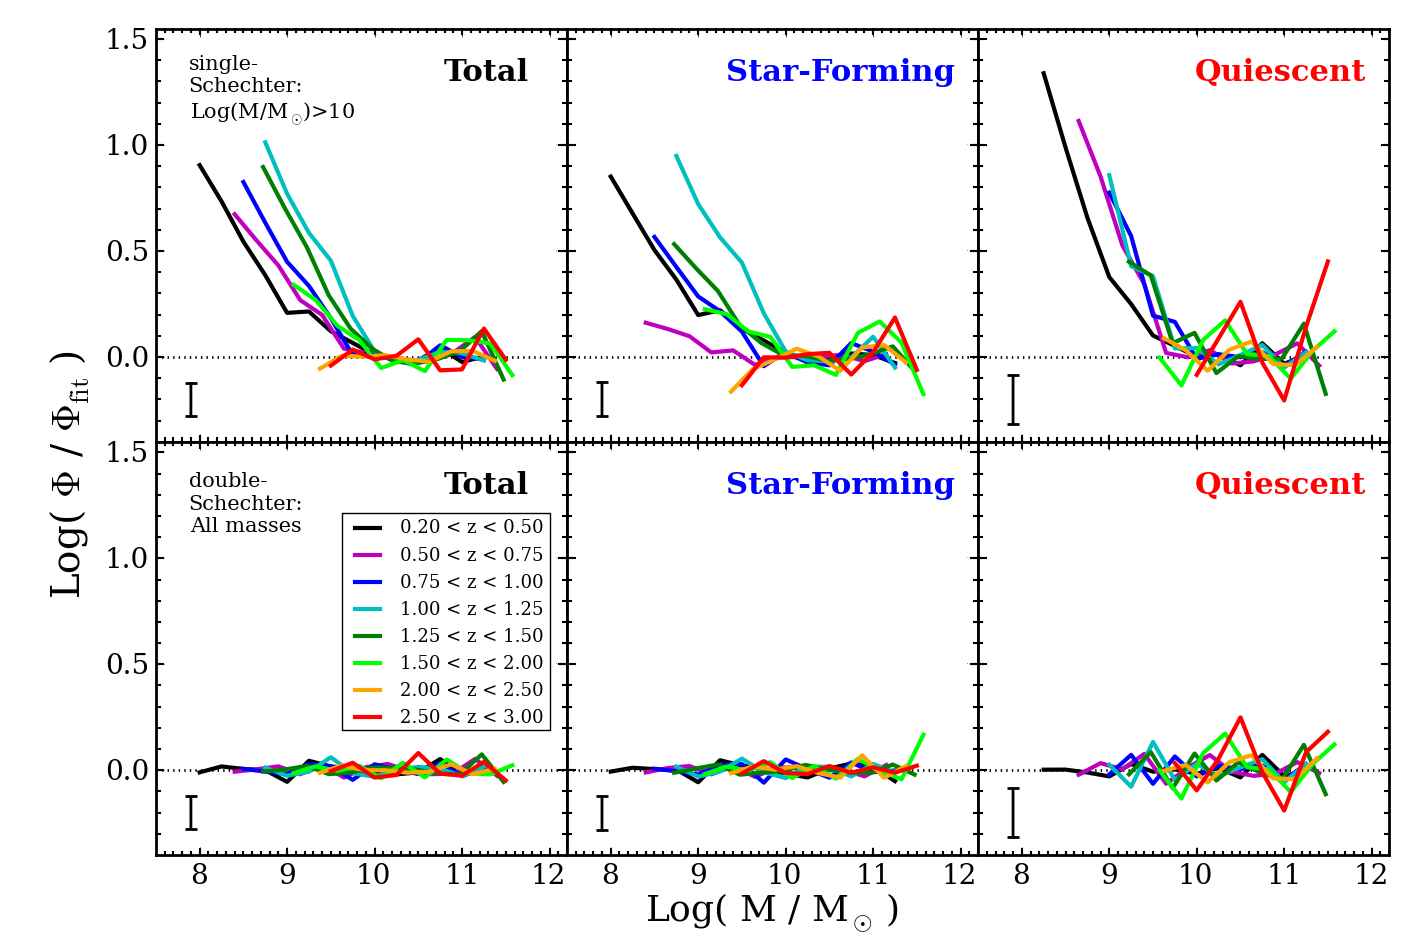
Residuals of double-Schechter (top) and single-Schechter (bottom) functions fit to each SMF, with characteristic uncertainties shown as errorbars in the lower left of each panel. Single-Schechter functions were fit only at masses greater than 10^10 Msol. These residuals illustrate the steepening of the SMF at low masses up to z~2.
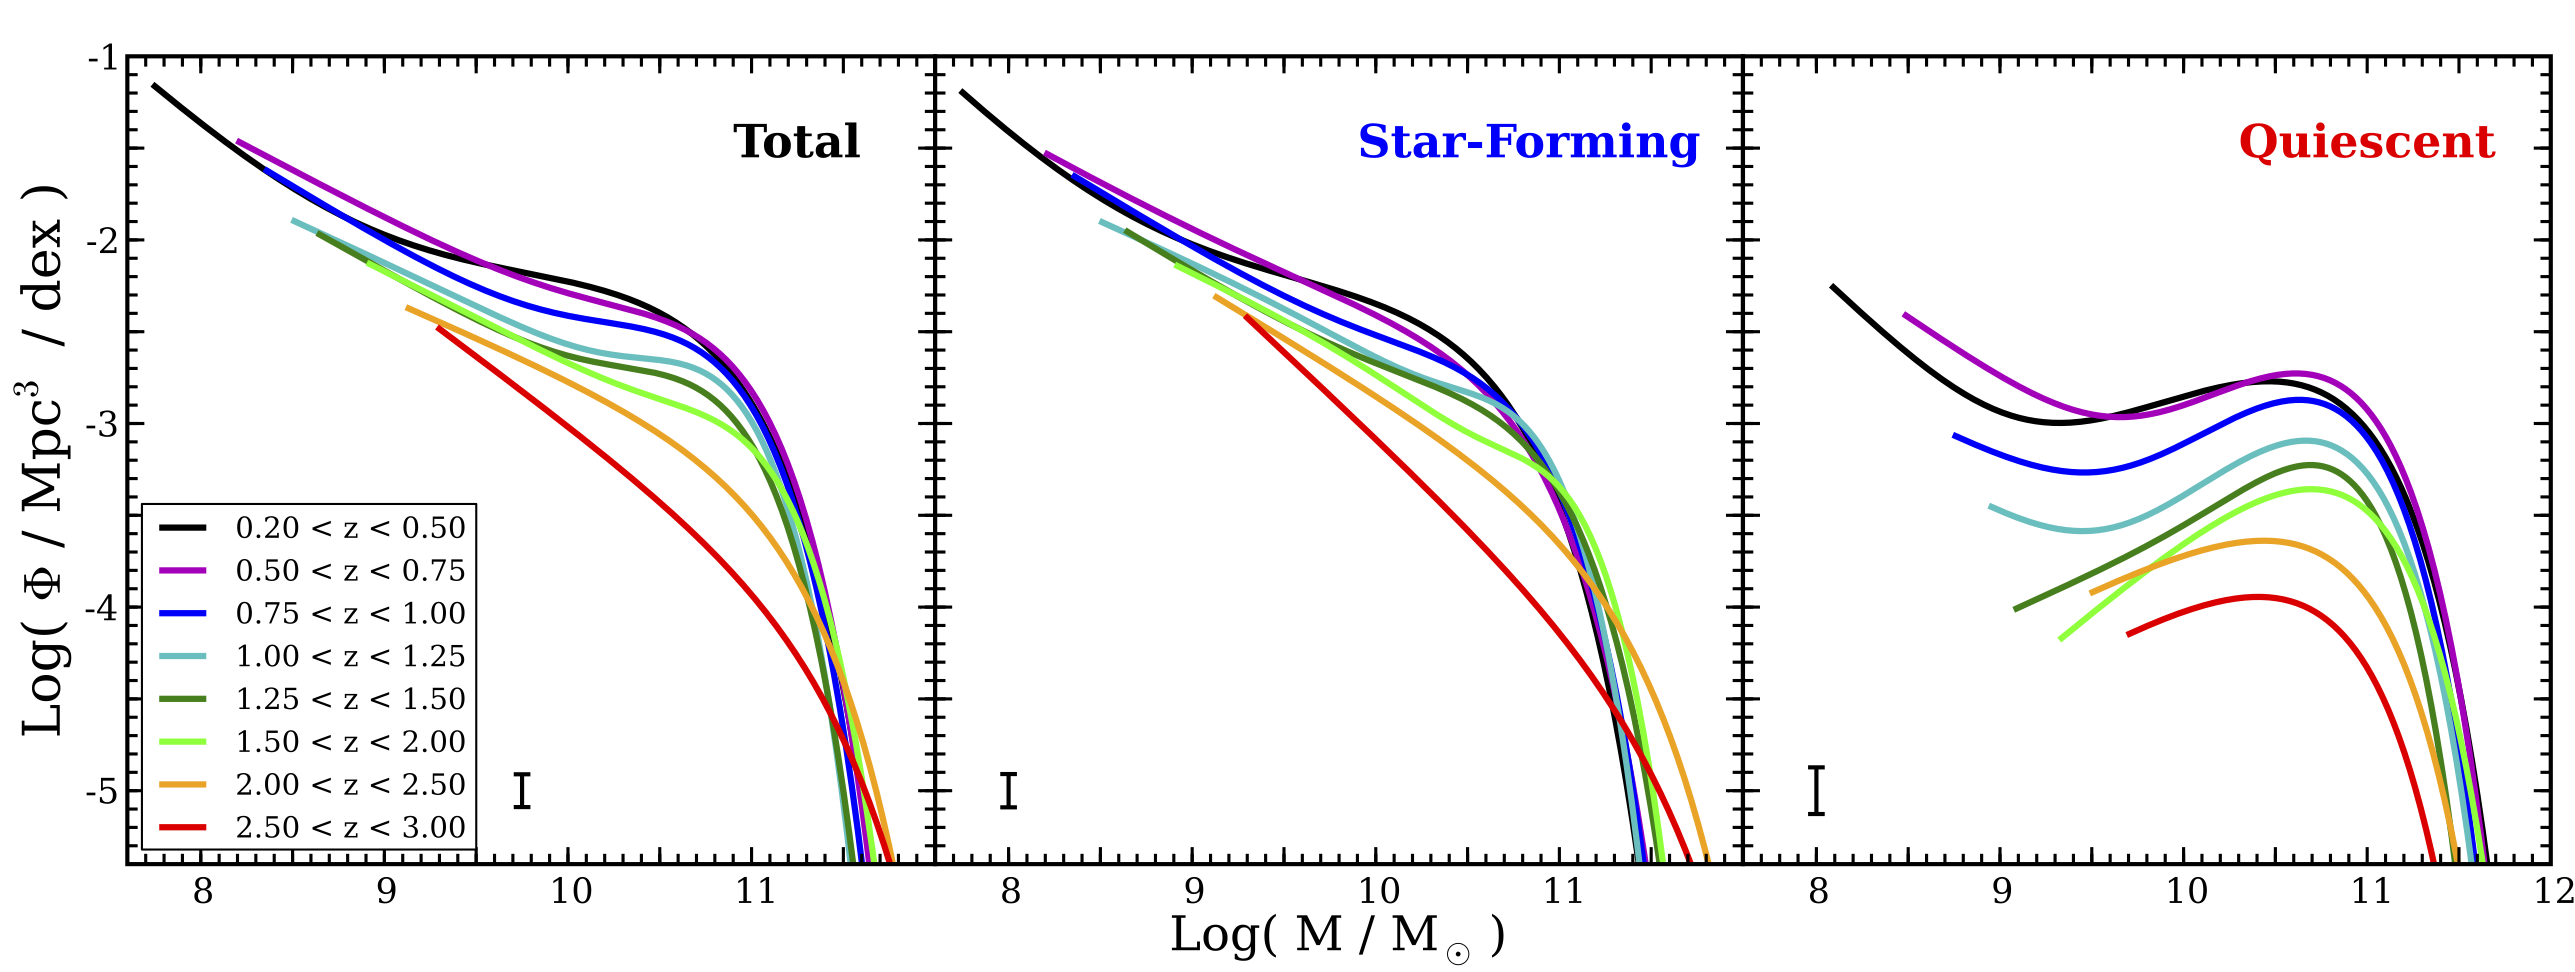
Stellar mass functions of all (left), star-forming (middle) and quiescent (right) galaxies. Representative uncertainties are shown as errorbars in the lower left of each panel. Only the best-fit Schechter function is shown (single vs. double) determined based on having a lower reduced chi-squared statistic.
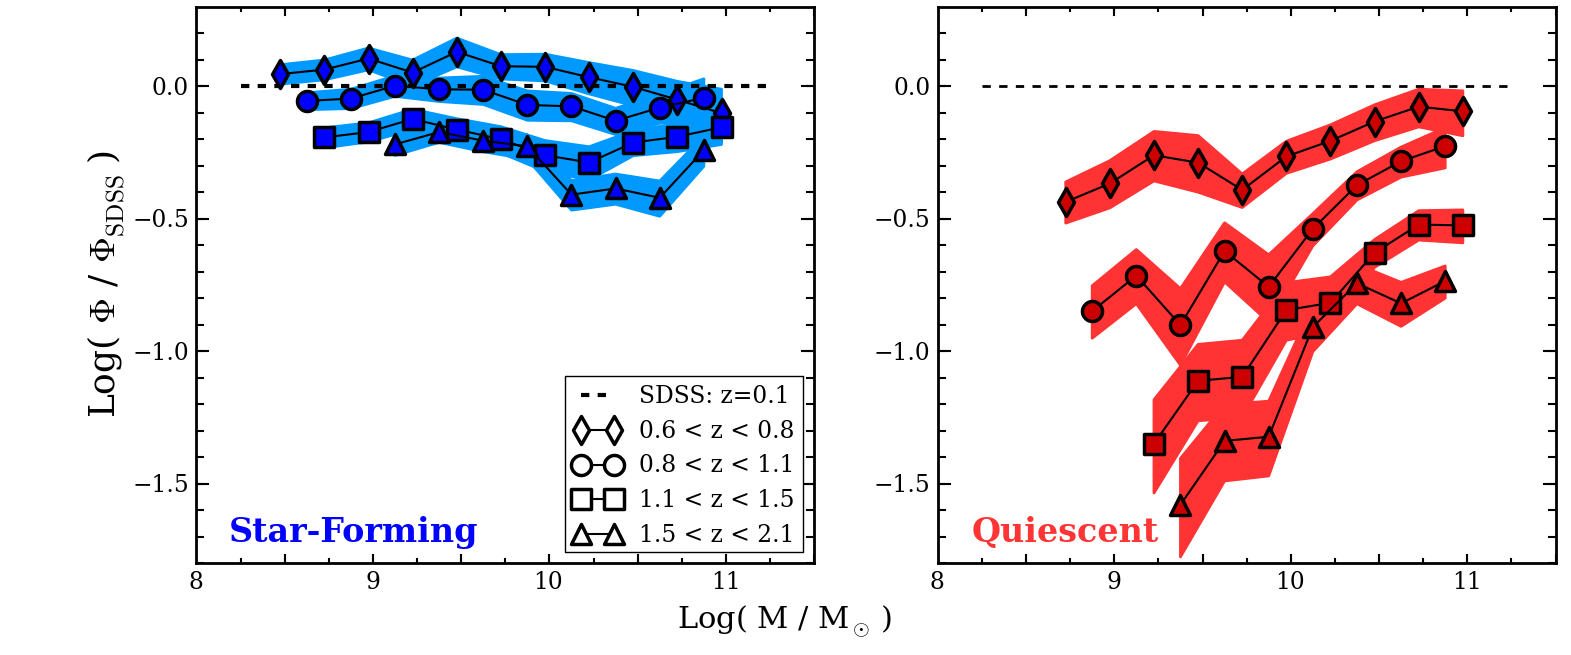
Star-forming and quiescent SMFs normalized to the z~0 measurement from the SDSS (Moustakas et al. 2013). Shaded regions correspond to 1 sigma uncertainties. The star-forming SMF shows a rather modest growth of roughly factor of two at all masses since z=2. The quiescent SMF, however, shows much greater growth ranging from a factor of five at high masses to a factor of ~25 towards lower masses.
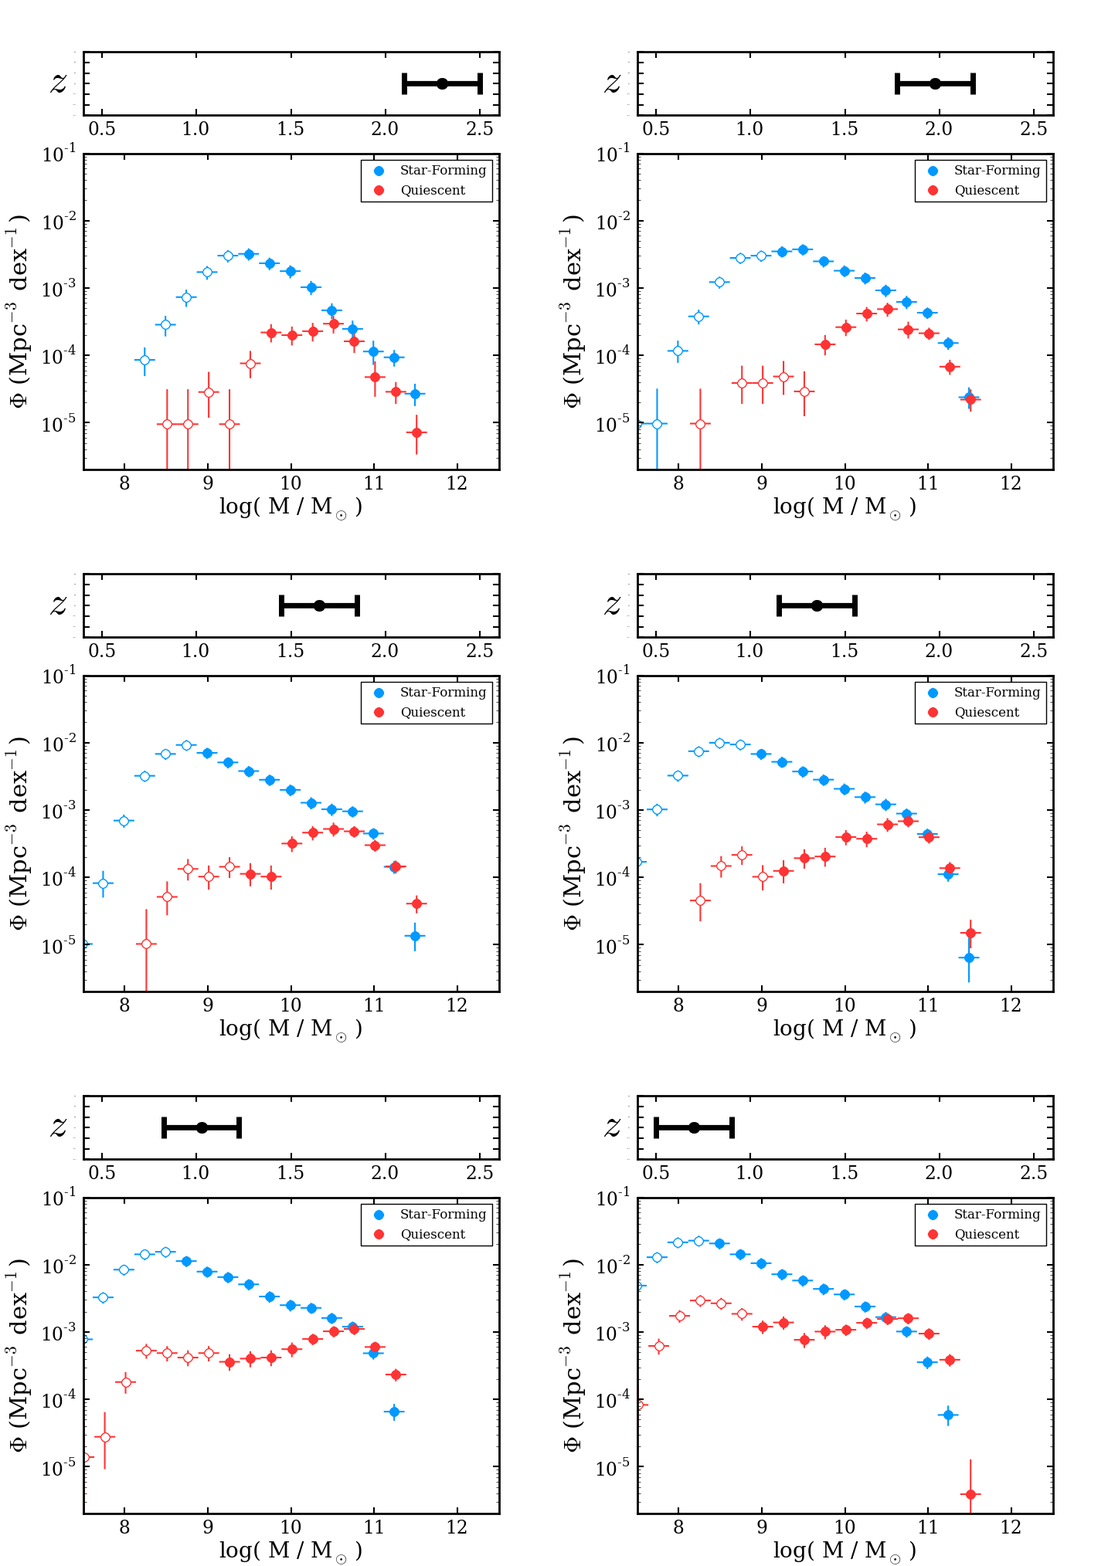
Growth of the star-forming and quiescent SMFs in a shifting redshift bin. Filled/empty points correspond to measurements above/below each population’s mass-completeness limit.
