Straatman 2016 Summary
Straatman et al. 2016 Summary: The FourStar galaxy evolution survey (ZFOURGE) is a 45 night legacy program with the FourStar near-infrared camera on Magellan and one of the most sensitive surveys to date. ZFOURGE covers a total of 400 arcmin2 in cosmic fields CDFS, COSMOS and UDS, overlapping CANDELS.
The redshift range 1 < z < 3, when the universe was between 2.1 and 5.6 Gyr old, is an important epoch for studies of galaxy evolution. During this period 60% of all star-formation took place, an early population of quiescent galaxies started to appear and galaxies evolved into the familiar elliptical and spiral morphologies that we see in the universe today.
A fundamental observational limitation to understanding galaxy evolution is the availability of accurate distance estimates. Many galaxy surveys rely exclusively on the photometric sampling of the spectral energy distributions (SEDs) of galaxies to derive redshifts. Even when deep imaging spanning the optical and near-infrared is used to derive photometric redshifts, these surveys are generally hampered by systematic effects from the use of broadband filters. These can lead to large random errors, of the order of σ /(1 + z) ∼ 0.1.
A better sampling of the SED improves the accuracy of the photometric redshifts greatly and can be obtained by the use of medium-bandwidth filters. With ZFOURGE we use 5 near-IR medium-bandwidth filters (J1,J2,J3,Hs,Hl) as well as broad-band Ks at 1.05 − 2.16 μm to 25 − 26 AB at a seeing of ∼ 0.5. Each field has ancillary imaging in 26-40 filters at 0.3 − 8 μm. We present photometric catalogs comprising > 70, 000 galaxies, selected from ultra-deep Ks-band detection images (25.5 − 26.5 AB mag, 5σ, total), and > 80% complete to Ks < 25.3−25.9 AB. With ZFOURGE we obtain redshift accuracies of σ /(1 + z) = 0.01 – 0.02.

Normalized transmission corresponding to the FourStar medium-bandwidth and ancillary filters, each panel representing a different field. From top to bottom: CDFS, COSMOS and UDS. We show the FourStar J1 , J2 , J3 , Hs , Hl and Ks medium-bandwidth filters with different shades of red. The UV to optical U, B, V, R, I and Z filters and the Spitzer/IRAC filters are shown with gray shaded curves. These correspond to different instruments in each field. The FourStar filters overlap with other broadband near-IR filters, e.g., HST/WFC3/F125W−F160W, while providing a higher resolution sampling. Atmospheric transmission was included in all FourStar filter curves.
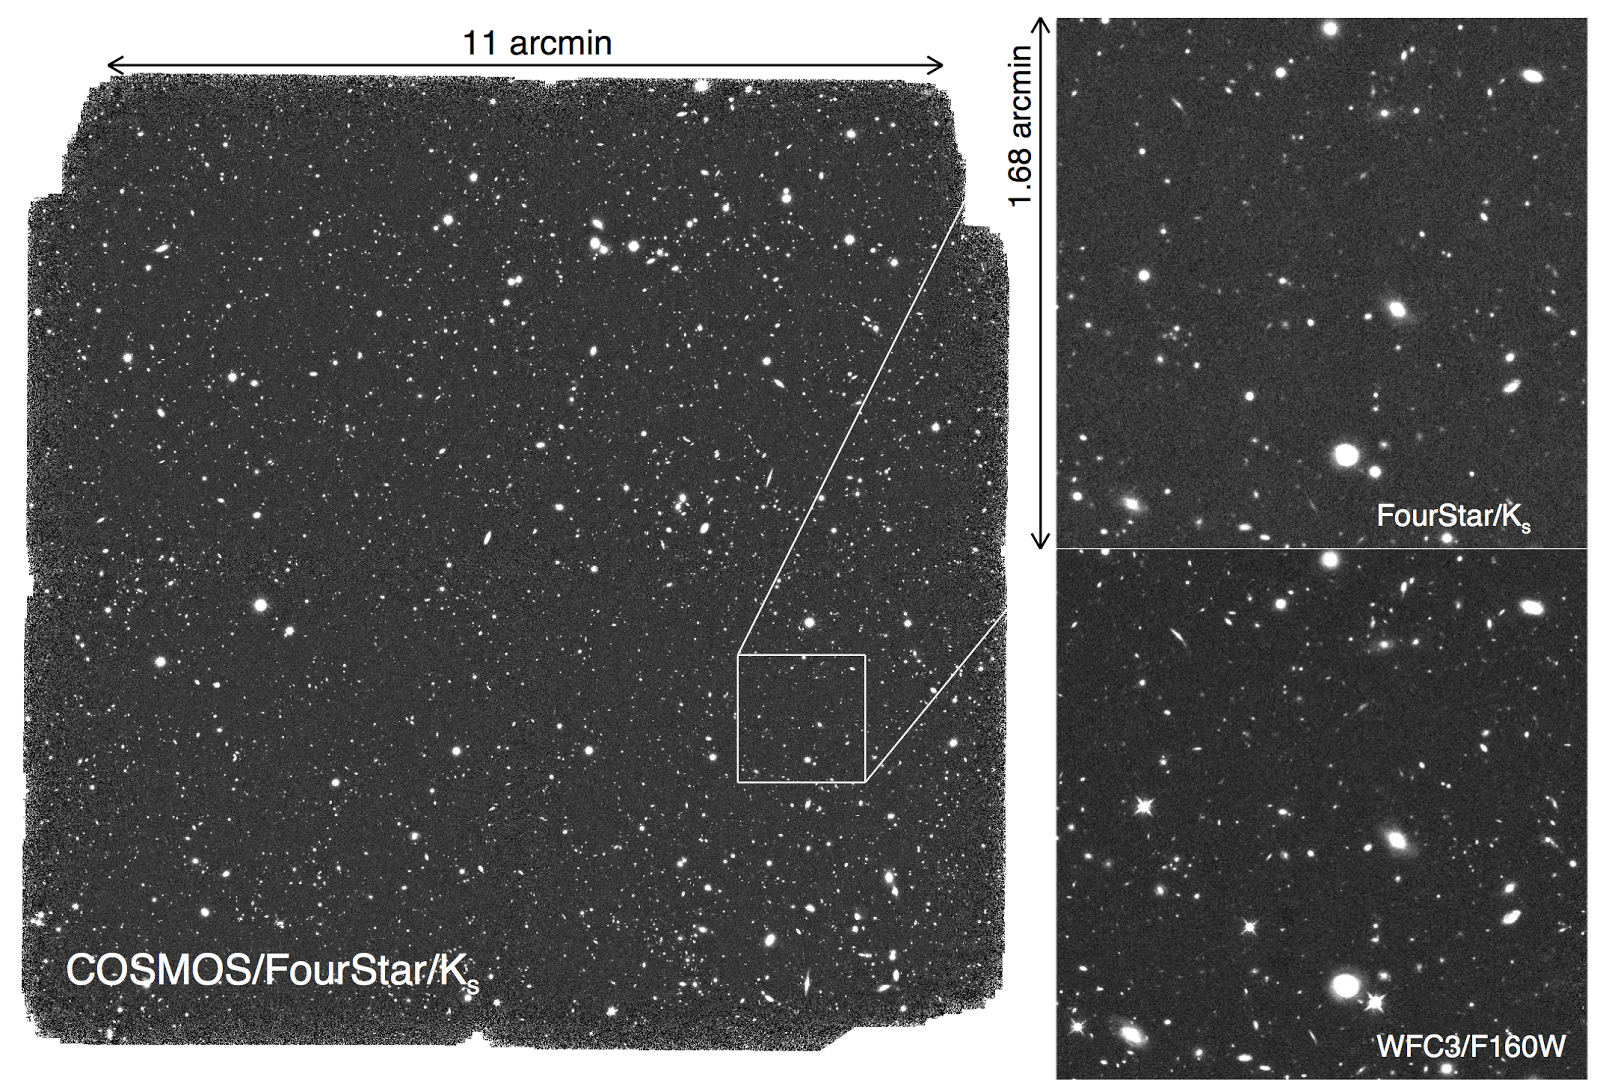
The FourStar/Ks-band reduced image in COSMOS. The FourStar footprint is 13′ × 13′. Top right: zooming in on a 1.68′ × 1.68′ region in the COSMOS field. Bottom right: the same region with HST/WFC3/F160W.
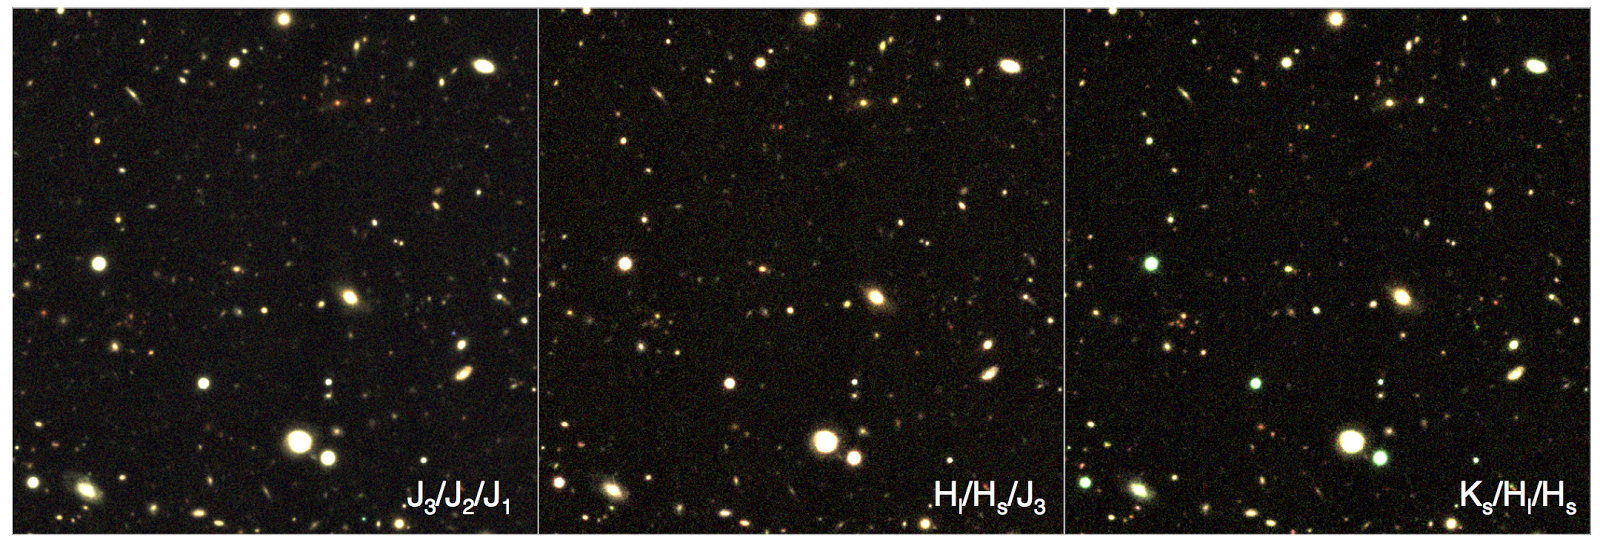
False color images of the same cutout region as shown in Figure 4, demonstrating the high quality obtained with the FourStar filters, as well as the usefulness of using medium-bandwidth filters to characterize the colors of galaxies within a classical J or H broadband. The filter combinations that were used in each panel are indicated at the bottom (red/green/blue).
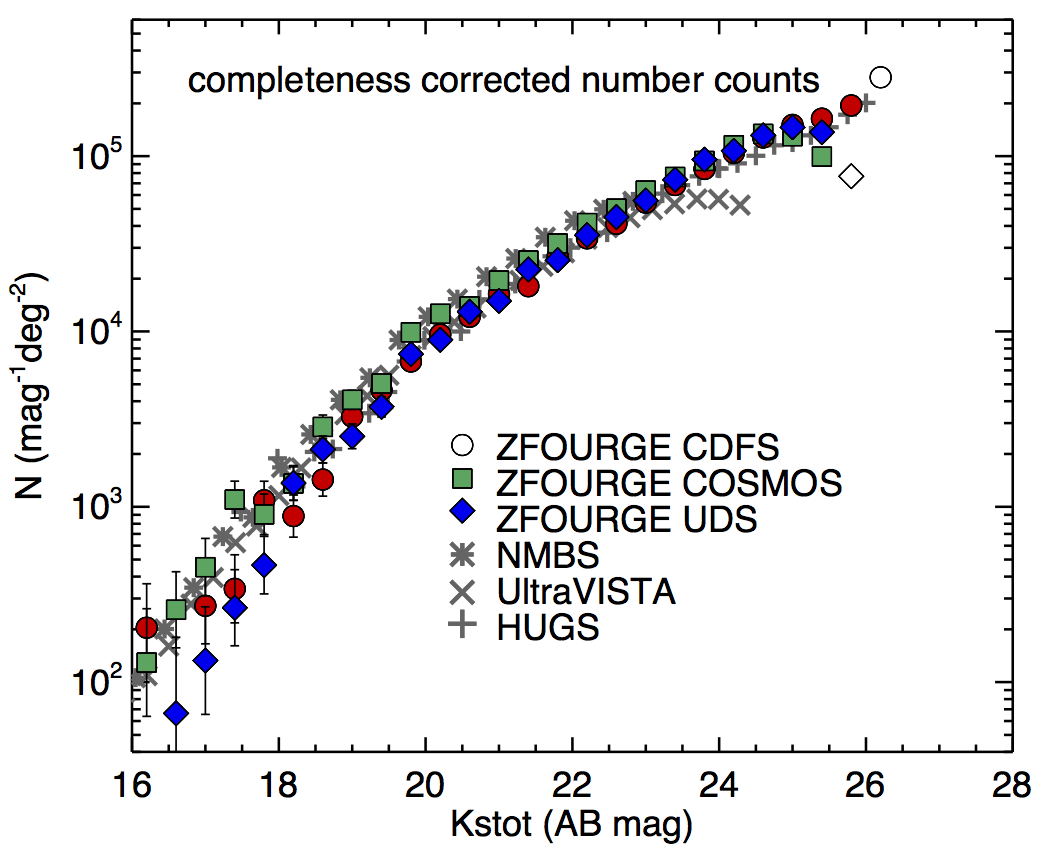
Completeness corrected number counts for each field observed with ZFOURGE. Sources with < 80% completeness are shown with open symbols. We recover at least 80% down to very deep Ks-band magnitudes of 25.4 − 25.9 and 50% down to 25.6 − 26.2. For comparison, the Ks-band completeness corrected number counts of similar galaxy surveys are indicated in grayscale.
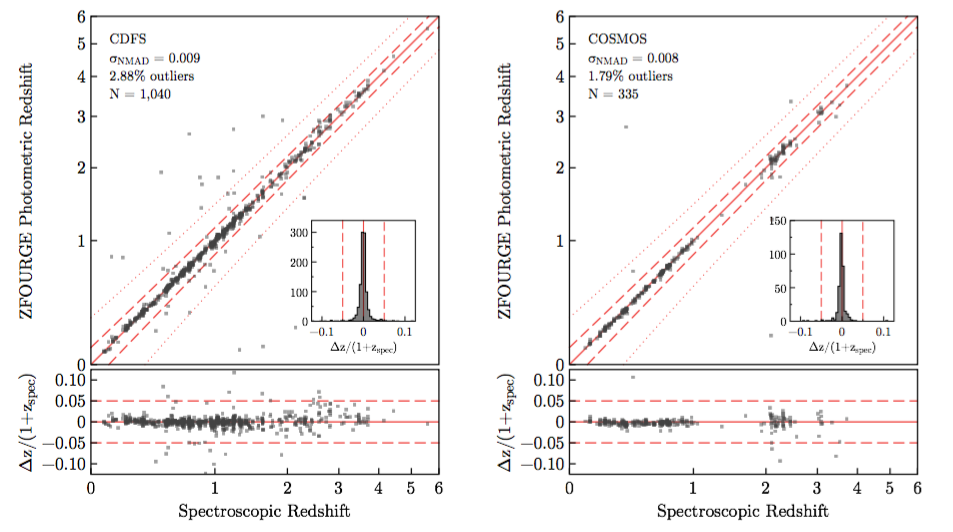
Compared with spectroscopic redshifts, the ZFOURGE photometric redshifts match extremely well. Top panels: Photometric redshifts from ZFOURGE versus spectroscopic redshifts in CDFS. The NMAD scatter, the fraction of objects with ∆z/(1 + zspec) > 0.15, and the number of galaxies with matches in both catalogs are shown in the upper left of the plot, while the histograms of ∆z/(1+zzspec) are shown as an inset in the bottom right of the plot. The NMAD scatter is only ~1%, indicative of very accurate redshifts. Bottom: the residual between the photometric and spectroscopic redshifts, divided by 1+zspec. The red solid, dashed and dotted lines indicate, respectively, ∆z/(1 + zspec) = 0 ± 0, ±0.05, and ± 0.15.
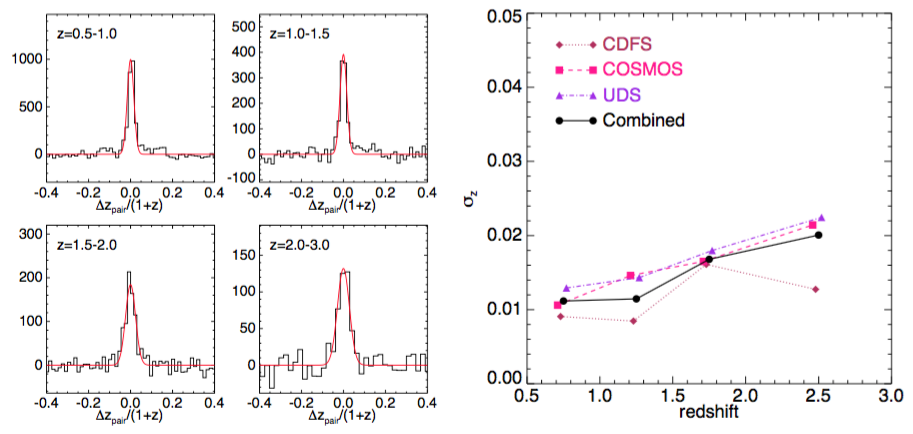
The drawback of comparing to spectroscopic samples is that these are usually biased towards bright (Ks < 22) star-forming galaxies, or unusual sources, such as AGN. Therefore these comparisons are not representative of the full photometric catalog and do not allow a careful study of how photometric redshift errors depend on galaxy properties. Here we present an alterna- tive statistical analysis by looking at galaxy pairs. This method was first described and validated by Quadri & Williams (2010). It does not rely on spectroscopic information and can be applied to the full catalogs, including faint sources. Therefore this technique provides us with a more representative photometric redshift uncertainty than possible by comparing to spectroscopic redshifts. Due to clustering, close pairs of galaxies on the sky have a significant probability of being physically associ- ated, and of lying at the same redshift. Other galaxy pairs will actually be chance projections along the line of sight, but this contamination by random pairs can be accounted for statistically, by randomizing the galaxy positions and repeating the analysis. Each true galaxy pair will give an independent estimate of the true redshift, and we can take the mean of the two values as our best estimate of the true redshift. The distribution of ∆zpairs/(1 + zmean) of the pairs of galaxies can then be used to estimate the average photometric redshift uncertainties. It is a narrow distribution for robustly derived redshifts, or broader if the redshifts are very uncertain. For illustration, we show the distributions of ∆z /(1 + z ) here in the left panel. The right panel shows σz,pairs for all three fields in ZFOURGE as a function of redshift, for galaxies with Ks<23.5.
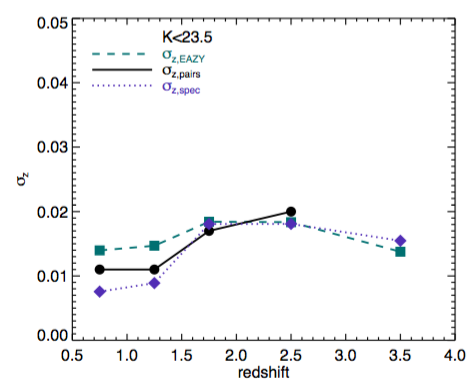
The outcome of the pairs test is consistent with the NMAD scatter derived from comparing with spectroscopic redshifts and with the uncertainties predicted by the template fitting software EAZY (Brammer et al, 2009).
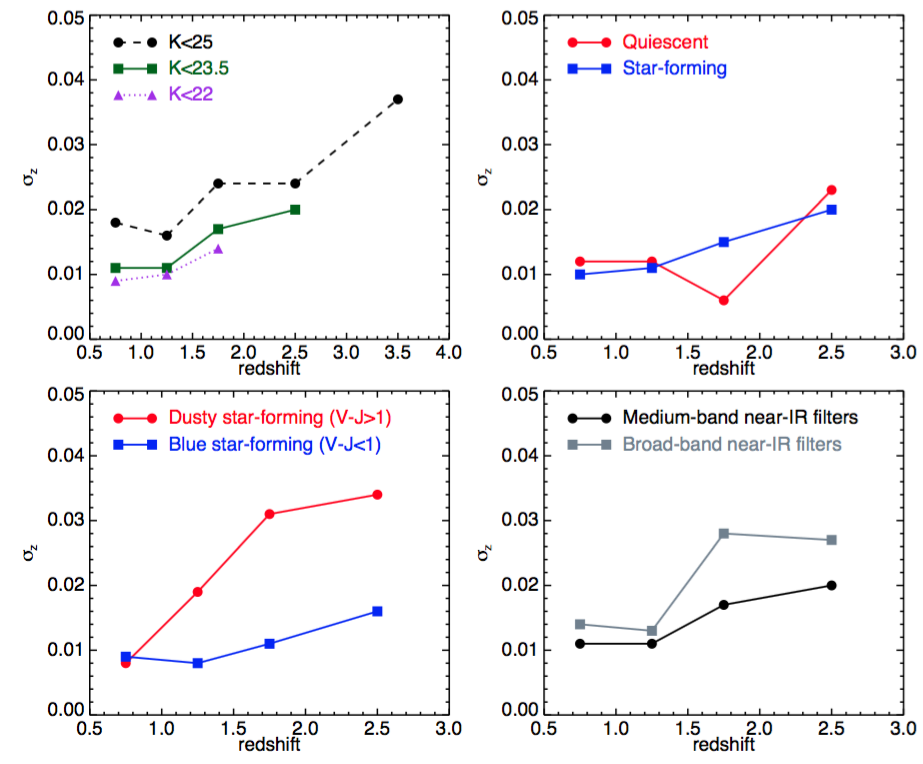
With the pair test we can investigate the redshift accuracy for different subsamples of the galaxy, for example using different brightness limits (top left panel), by selecting on star-formation activity (top right) and rest-frame V-J color (bottom left). We can also quantify how well the accuracy has increased from adding the near-IR medium bandwidth filters (bottom right).
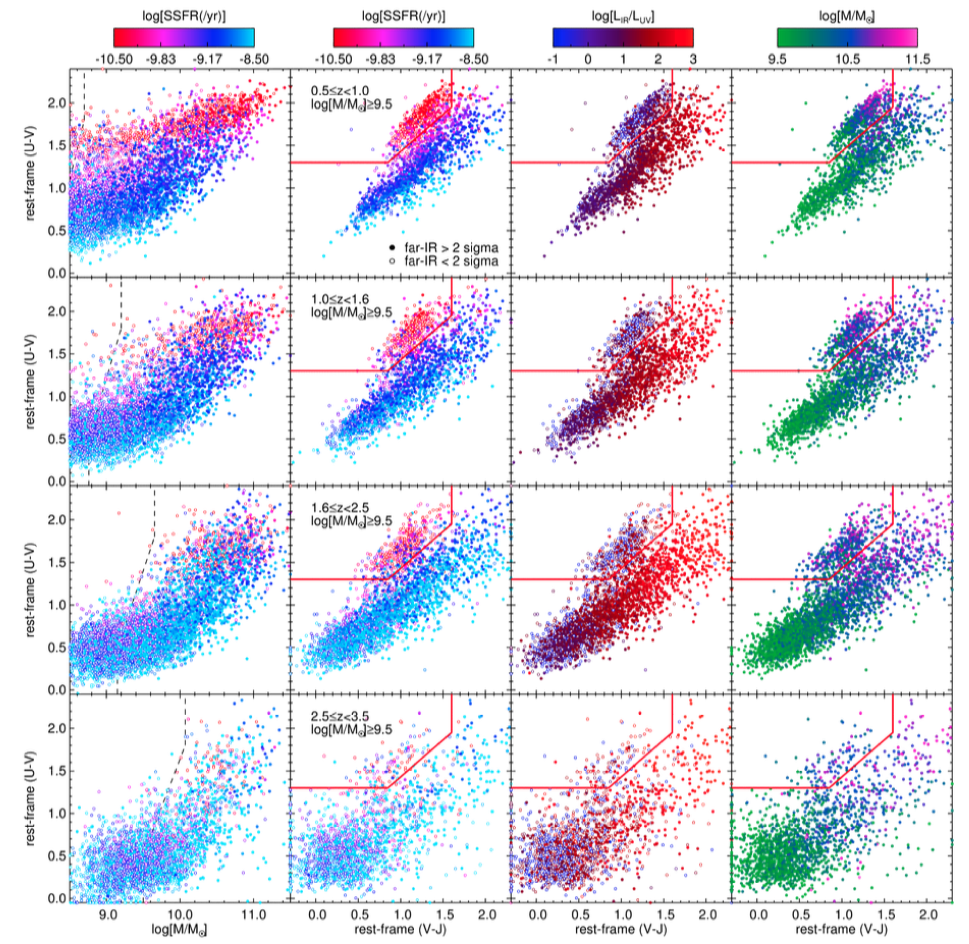
The ZFOURGE catalogs include SFRs from UV and IR light from deep publicly available Spitzer/MIPS/24 micron data and Herschel/Pacs 100 and 160 micron data. This Figure shows rest-frame U − V versus stellar mass (left columns) or versus V − J (second, third and fourth columns) for a mass complete sample of galaxies with SNRKs > 10 and stellar mass M > 109.5M⊙, in four redshift bins (top to bottom). The vertical dashed lines indicate our stellar mass completeness limit. The red solid line in the UVJ diagrams separates quiescent (top left) from star forming (bottom left to top right) galaxies. Galaxies that are undetected in the far-IR at < 2σ are shown with open symbols. The sSFRs decrease towards blue V − J and red U − V colors, reflecting a gradient in age (see also below). Galaxies with the lowest sSFRs are located in the quiescent region of the diagram, with red U −V and blue V −J colors. Galaxies span a large range in log[LIR/LUV ], ranging from −1 for the bluest UVJ star-forming galaxies to 3 for the dustiest sources, and quiescent galaxies having low log[LIR/LUV ]. A mass sequence is also visible, where massive galaxies tend to be redder.
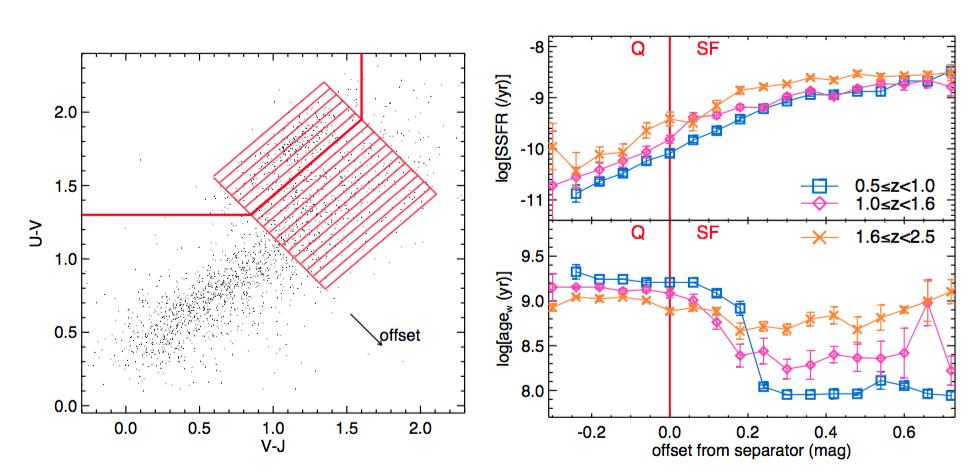
Bins in UVJ space, set orthogonally to the red line that separates quiescent from star-forming galaxies. In these bins we measure the bootstrapped median SSFR and weighted age: agew. The underlying datapoints are a randomly chosen subsample from Figure 25 to illustrate the general locus of galaxies in the diagram. Right: Gradient in SSFR (top) and agew (bottom) with increasing distance from the separator. Datapoints on the left of the red line represent quiescent galaxies (“Q”) and datapoints on the right star-forming galaxies (“SF”). SSFR increases towards bluer U − V and V − J, while agew decreases.
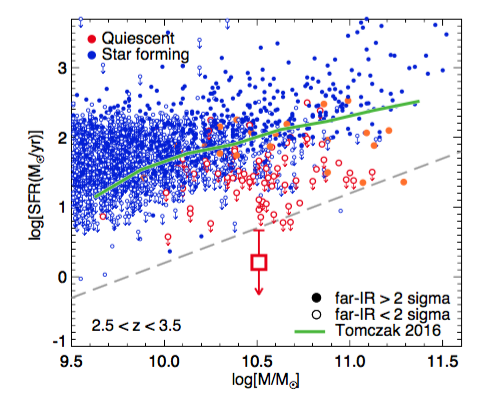
Finally, with our data we can constrain if the UVJ diagram gives an accurate representation of the star-formation activity of galaxies. This was not yet proven for galaxies at z=3. This Figure shows SFR versus stellar mass for galaxies at 2.5 < z < 3.5. We show UVJ selected star-forming galaxies in blue and UVJ selected quiescent galaxies in orange/red. Galaxies with < 2σ measurements in the far-IR are shown with open symbols. Downward pointing arrows are < 1σ limits on SFR. The large square symbol represents the median SFRIR of 21 undetected quiescent galaxies in CDFS. The thick green line is the median SFR-stellar mass relation for star-forming galaxies from Tomczak et al. (2016), and the gray dashed line represents the criterion for quiescence at z = 3. On average, we can derive an upper limit on the SFR of z=3 UVJ selected quiescent galaxies, using the deep far-IR data from Spitzer and Herschel. This shows us that they are indeed quiescent (large square symbol with arrow).
