Kawinwanichakij 2014 Summary
We study the statistical distribution of satellites around star-forming and quiescent central galaxies at 1< z < 3 using imaging from the FourStar Galaxy Evolution Survey (ZFOURGE) and the Cosmic Assembly Near-IR Deep Extragalactic Legacy Survey (CANDELS). The deep near-IR data select satellites down to M/Msol >10^9 at z < 3. Massive quiescent centrals (M/Msol > 6 x 10^10) have ~ 2 times the number of satellites compared to star-forming centrals with a significance of 2.7 sigma even after accounting for differences in the centrals’ stellar-mass distributions. Comparing to the Guo et al. (2011) semi-analytic model, the excess number of satellites indicates that quiescent centrals have halo masses 0.3 dex larger than star-forming centrals, even when the stellar-mass distributions are fixed.
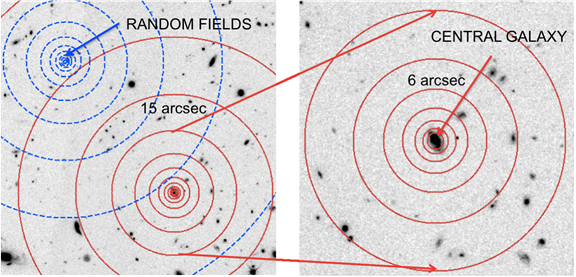
Demonstration of the statistical technique to measure the radial number density profile of satellite galaxies. We count satellites in each annulus around each central (red solid circles) and also around randomly selected positions in the field (blue dashed circles). We use many random fields per each central and calculate the average to infer the statistical distribution of foreground and background galaxies.
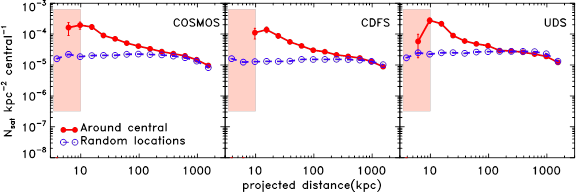
The average projected radial profile of satellites around central galaxies at 1 < z < 3 with stellar masses of M/Msol > 3 x 10^10 and the field in each pointing of ZFOURGE (COSMOS, CDFS, and UDS). The measured projected distribution of satellites is calculated by subtracting the average random profile (blue lines with open circles) from that measured around the central galaxy profile (red lines with filled circles).
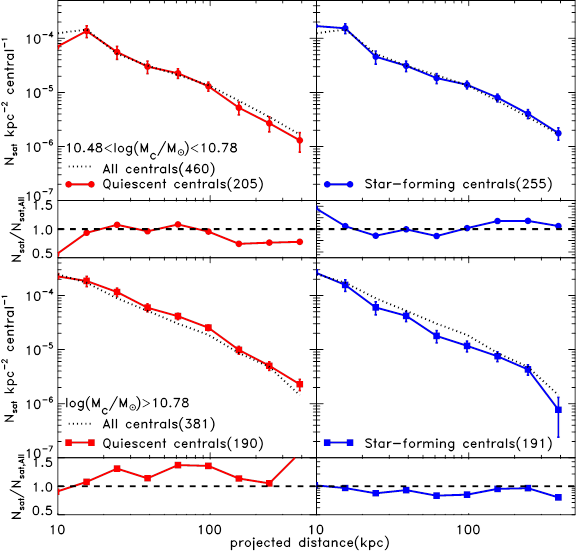 The dependence of the number density of satellites on star-formation activity and stellar mass. Top: the projected radial profile around all intermediate mass centrals (3 x 10^10 < M/Msol < 6 x 10^10, black dotted line) compared with quiescent centrals (red solid line with circles, left panel) and star-forming centrals (blue solid line with circles, right panel). Bottom: same as top panels, but for high-mass centrals (M/Msol > 6 x 10^10). The number in parentheses is the number of centrals in each subsample. Below each Nsat plot we show the ratio of Nsat around quiescent or star forming centrals to the Nsat around all centrals. For intermediate mass centrals we do not find a significant difference in satellite content, but at high masses we find that quiescent centrals have ~2 times the number of satellites at 3 sigma significance.
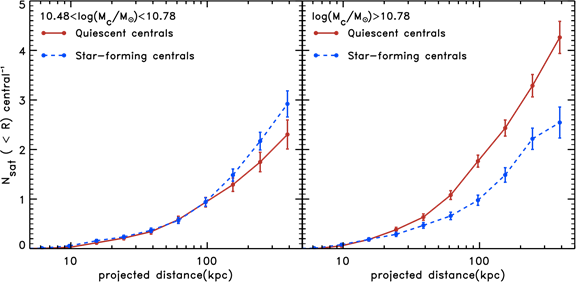
The difference in satellite content is made clearer by inspecting the cumulative number of satellites.
The cumulative plots for the intermediate mass centrals (3 x 10^10 < M/Msol < 6 x 10^10) and the high mass centrals (M/Msol > 6 x 10^10) are shown in the left and the right panels, respectively. At 1 < z < 3 centrals with these stellar masses have between 2 and 4 satellites within 400 kpc depending on mass and star-formation activity.
We use a simple toy model that relates the quenching of star formation and halo mass, and attempts to explain the large inferred difference in halo mass between star-forming and quiescent galaxies at high stellar masses, while maintaining a smaller difference at intermediate stellar masses. We use published stellar-to-halo mass relations, as well as the relationship between Nsat and halo mass determined from a semi-analytic model, to infer halo masses. Our model roughly reproduces the quenched fraction (fq) as a function of mass (middle panel, observed fq and predicted fq are shown as small filled circle and large open circle, respectively.) and the differences in halo mass between star-forming (small blue circles, right panel) and quenched galaxies (large red circles, right panel) only if galaxies have a quenching probability that increases with halo mass from 0 for Mh/Msol ~ 10^11 to ~ 1 for Mh/Msol ~ 3 x 10^13 (left panel). A single halo-mass quenching threshold is unable to reproduce the quiescent fraction and satellite distribution of centrals.

