Allen 2017 Summary
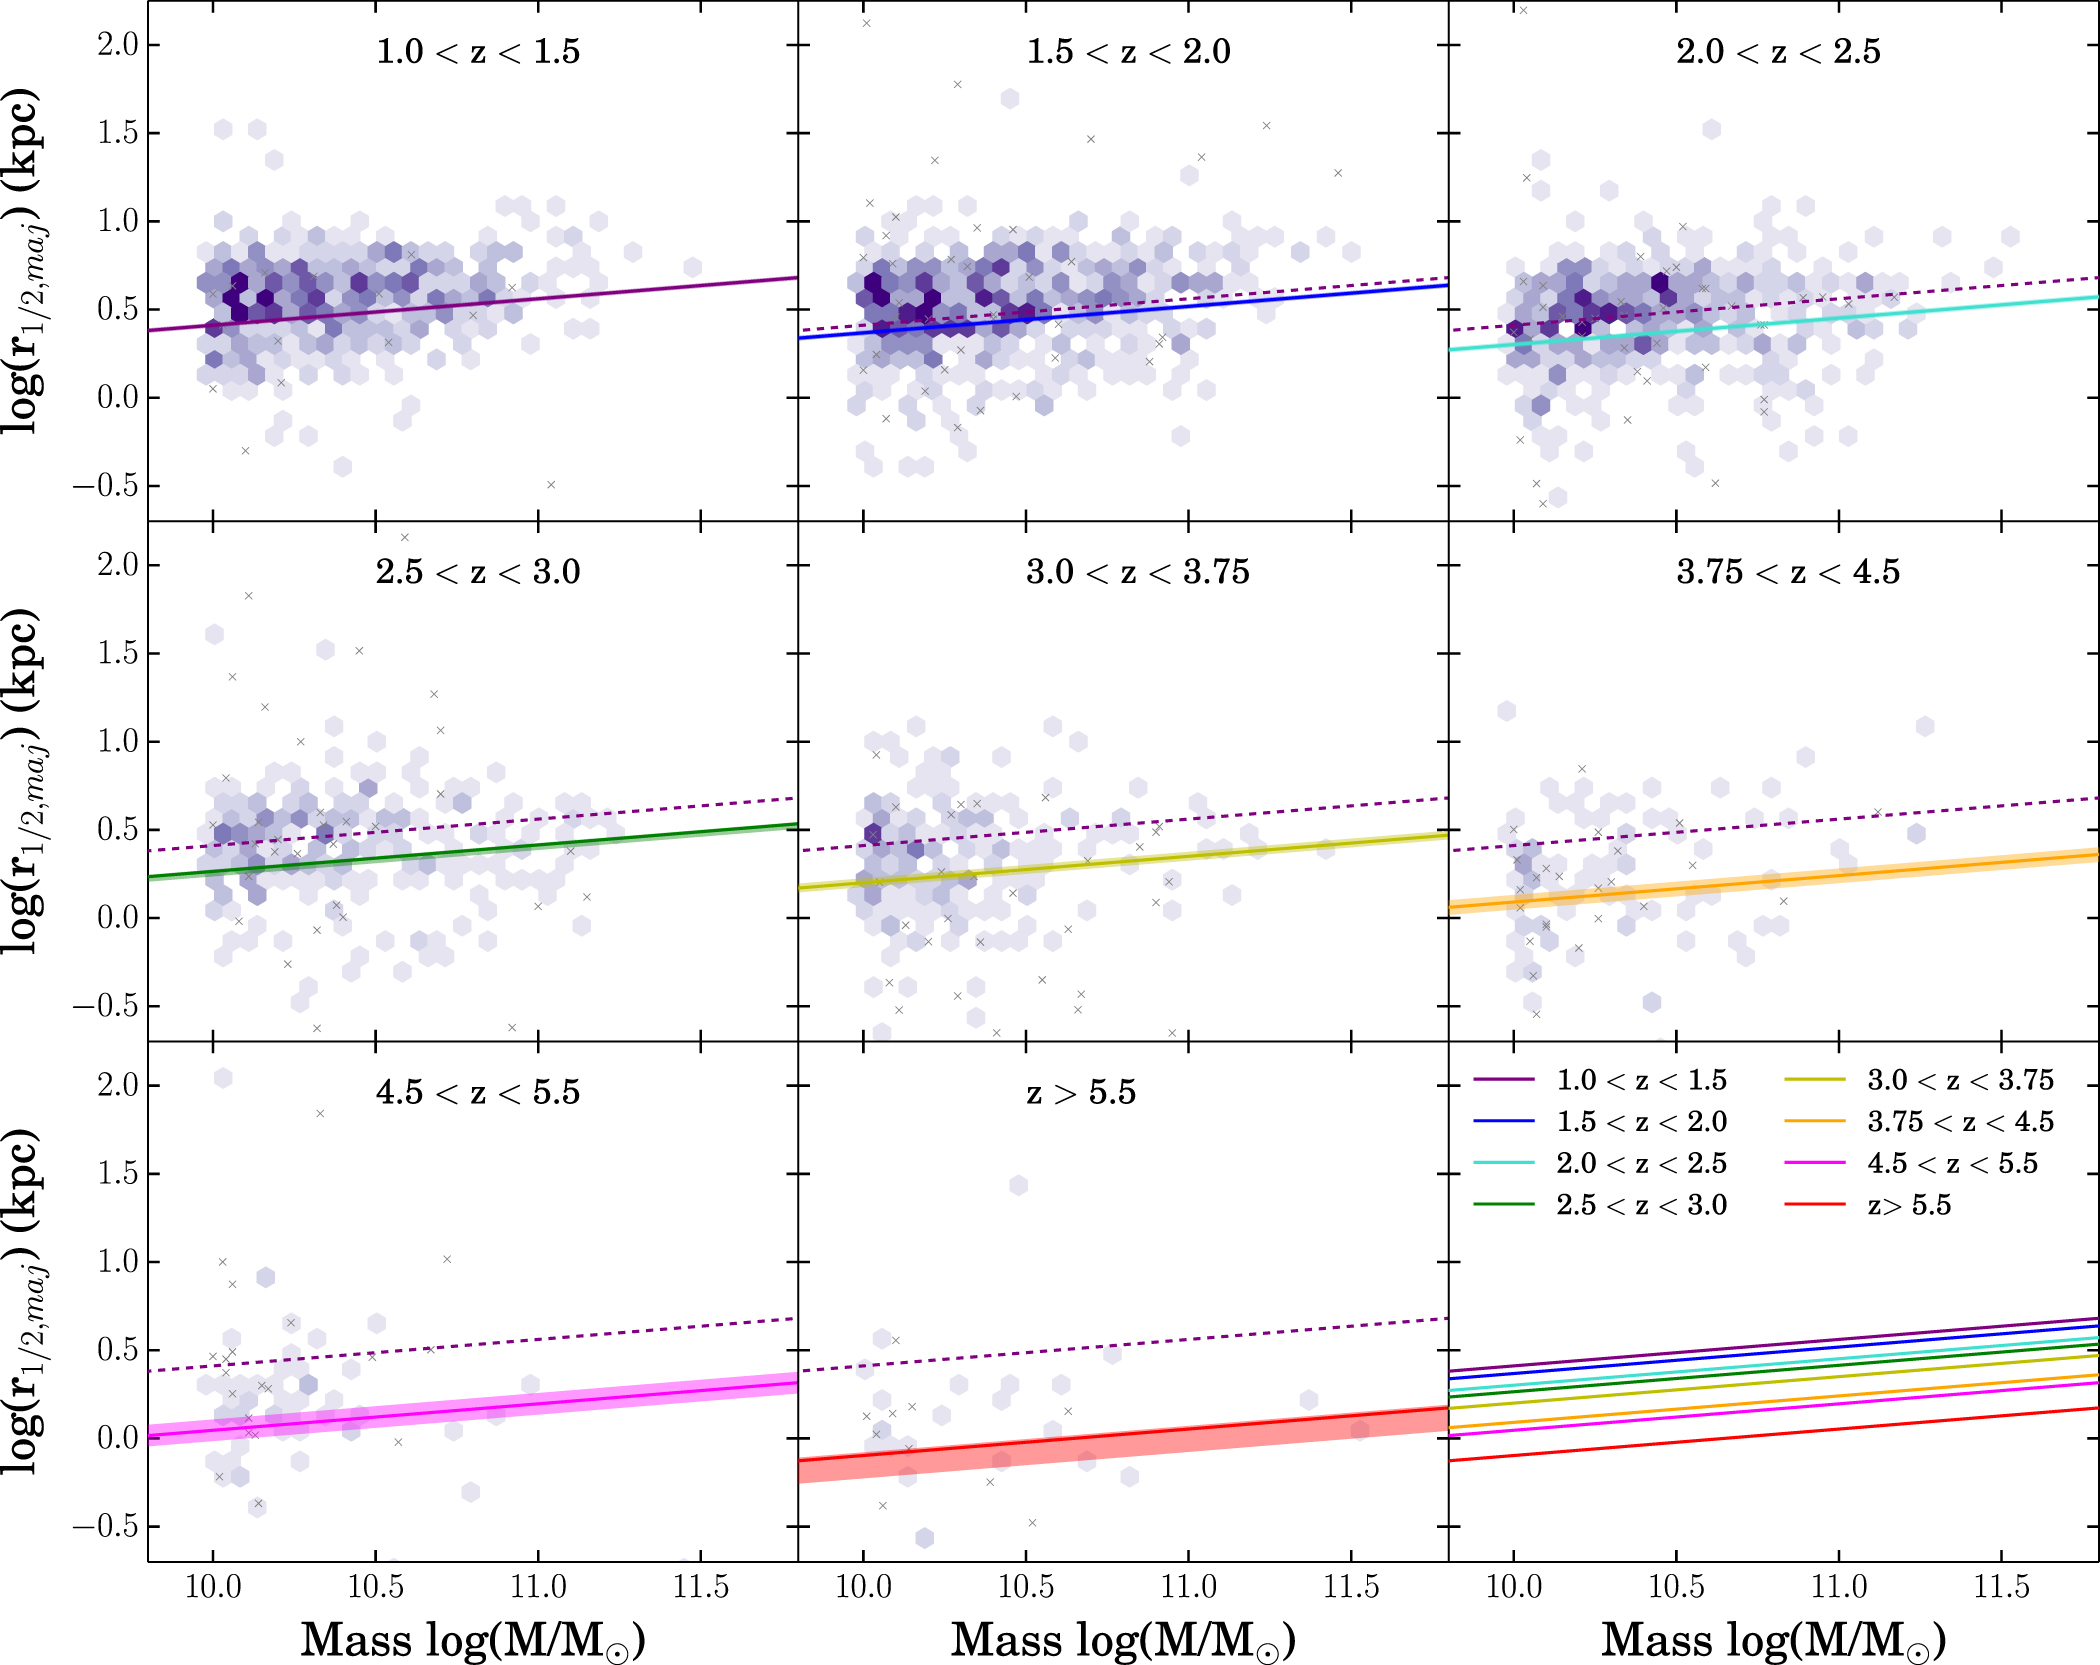
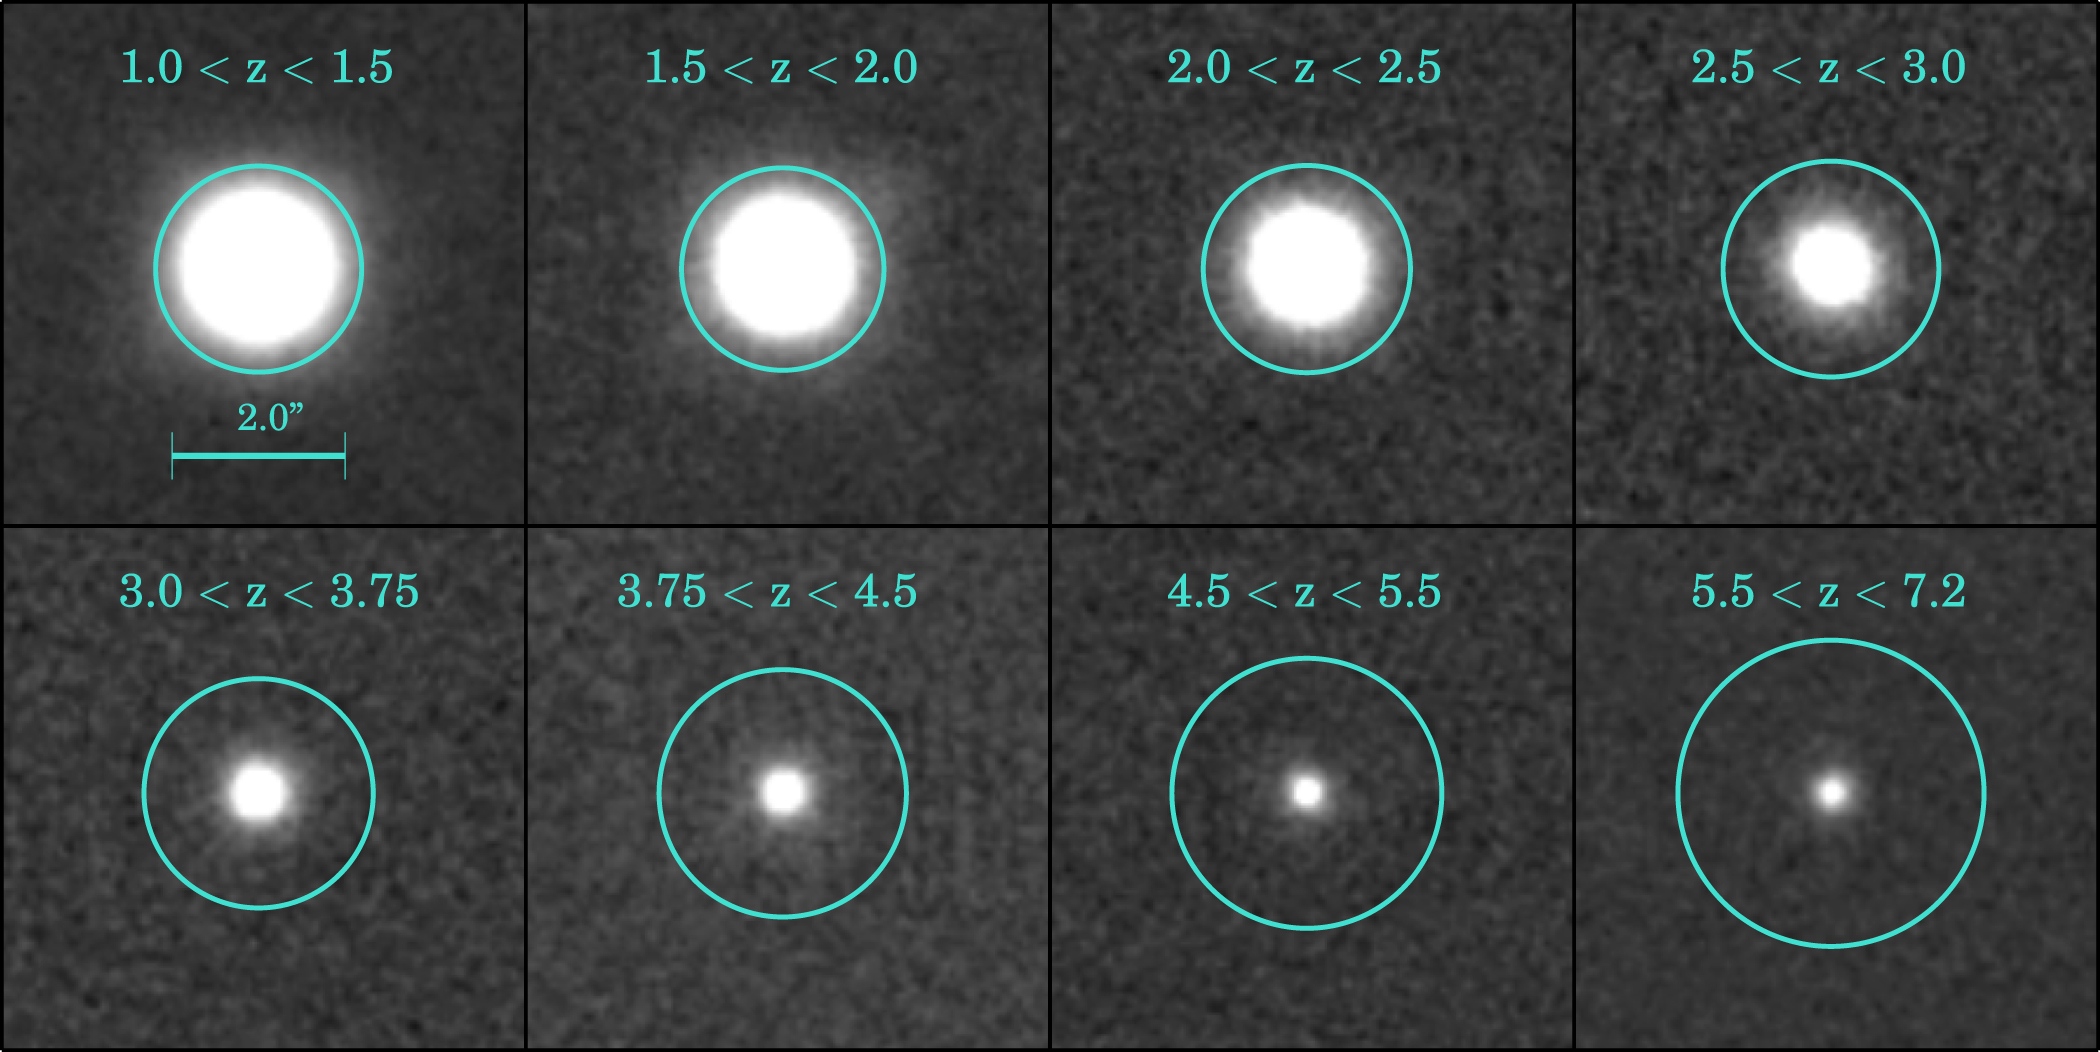
For the first time, we trace the size evolution of a complete sample of star-forming galaxies to z ∼ 7 and confirm that the mass−size relation exists at this redshift. We obtain average sizes in redshift bins by fitting the mass–size relation and by measuring the half-light radius from image stacks. The sizes of star- forming galaxies at z ∼ 7 are extremely compact and have r1 2,maj ~ 1kpc.
When we fit average galaxy sizes as a function of time, we find a steeper size evolution of the form re = 7.07 (1 + z )-0.89 kpc compared to previous mass-compete works, but different from the size evolution found for Lyman Break Galaxies (LBGs). Therefore, we conclude the LBGs likely represent a subset of highly star-forming galaxies that exhibit rapid size growth at z > 4.

Left panel: the evolution of star-forming galaxy sizes to z ∼7. We show average sizes via fitting the mass−size relation, as blue diamonds, and position angle corrected (uncorrected) average sizes from image stacks as solid (open) purple diamonds. Averages calculated via fitting the mass−sizerelation are consistent with corrected average sizes measured from image stacks. We fit the size evolution (blue line) and find re = 7.07 (1 + z)0.89 kpc for star-forming galaxies with log(M/Msol >10). Right panel: we compare our fit to the size evolution of star-forming galaxies with previous mass-complete studies. Grey points are from van der Wel et al. (2014). When we fit their data below z=3 using the same normalisimg mass we measure consistent sizes shown as black points. The grey star from Straatman et al. (2015) is the median circularized size. The grey contour represents the median circularized sizes and 16th and 84th percentile distribution of individual sizes for star-forming galaxies with 10<log(M/Msol )<10.5(Shibuya et al. 2015). The turquoise contour represents the median and percentile distribution of simulated disk sizes from Liu et al. (2016).

Evolution of star-forming galaxy sizes from our mass-complete sample compared to the size evolution derived for LBGs. The green triangles and dashed line are the median circularized sizes and fit to the size evolution of LBGs with 9.5<log(M/Msol )<10.4 (Mosleh et al. 2012). The green dotted–dashed line is our fit to the best-fit sizes (green circles) from the luminosity−size relation of LBGs with L = 1 L*,z=3 from Shibuya et al. (2015). Both green lines are offset in size normalization due to mass selection effects; however, it is important to note that the LBG size evolution slopes are different, which indicate a different growth rate from typical star-forming galaxies. This is further shown in the inset histogram where we include measured slopes for LBGs from previous works listed in Shibuya et al. (2015, Table 7). The average of those slopes is 1.20±0.06 (green error bars), which is significantly steeper compared to our slopes determined from the mass−size relation (blue line with errors) and the median of circularized sizes (blue dashed line with errors).

